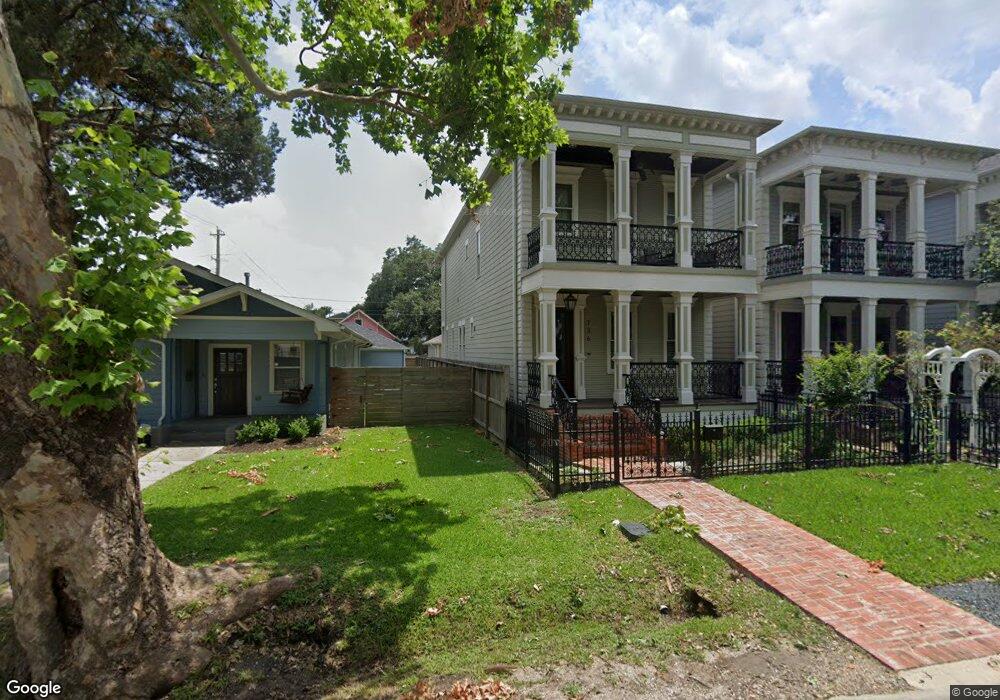
736 E 28th St Houston, TX 77009
Greater Heights NeighborhoodEstimated Value: $654,000 - $674,830
3
Beds
3
Baths
2,220
Sq Ft
$301/Sq Ft
Est. Value
About This Home
This home is located at 736 E 28th St, Houston, TX 77009 and is currently estimated at $667,708, approximately $300 per square foot. 736 E 28th St is a home with nearby schools including Field Elementary School, Hamilton Middle, and Heights High School.
Ownership History
Date
Name
Owned For
Owner Type
Purchase Details
Closed on
Jan 4, 2016
Sold by
Gpa Investments Corp
Bought by
Snyder W Brendan
Current Estimated Value
Home Financials for this Owner
Home Financials are based on the most recent Mortgage that was taken out on this home.
Original Mortgage
$346,000
Outstanding Balance
$275,361
Interest Rate
3.98%
Mortgage Type
New Conventional
Estimated Equity
$392,347
Purchase Details
Closed on
Aug 19, 2014
Sold by
Hubley Grover
Bought by
Gpa Investments Corp
Purchase Details
Closed on
Jul 2, 2014
Sold by
P G Hubley Investments Ltd
Bought by
Hubley Grover
Create a Home Valuation Report for This Property
The Home Valuation Report is an in-depth analysis detailing your home's value as well as a comparison with similar homes in the area
Home Values in the Area
Average Home Value in this Area
Purchase History
| Date | Buyer | Sale Price | Title Company |
|---|---|---|---|
| Snyder W Brendan | -- | Veritas Title Partners | |
| Gpa Investments Corp | -- | -- | |
| Gpa Investments Corp | -- | -- | |
| Hubley Grover | -- | None Available |
Source: Public Records
Mortgage History
| Date | Status | Borrower | Loan Amount |
|---|---|---|---|
| Open | Snyder W Brendan | $346,000 |
Source: Public Records
Tax History
| Year | Tax Paid | Tax Assessment Tax Assessment Total Assessment is a certain percentage of the fair market value that is determined by local assessors to be the total taxable value of land and additions on the property. | Land | Improvement |
|---|---|---|---|---|
| 2025 | $10,238 | $673,569 | $195,000 | $478,569 |
| 2024 | $10,238 | $662,345 | $195,000 | $467,345 |
| 2023 | $10,238 | $604,000 | $195,000 | $409,000 |
| 2022 | $13,345 | $606,061 | $150,000 | $456,061 |
| 2021 | $13,616 | $584,194 | $150,000 | $434,194 |
| 2020 | $13,477 | $556,544 | $150,000 | $406,544 |
| 2019 | $14,234 | $567,208 | $150,000 | $417,208 |
| 2018 | $10,102 | $511,381 | $135,000 | $376,381 |
| 2017 | $13,286 | $525,453 | $135,000 | $390,453 |
| 2016 | $13,905 | $549,906 | $102,000 | $447,906 |
| 2015 | -- | $0 | $0 | $0 |
Source: Public Records
Map
Nearby Homes
- 734 E 28th St
- 732 E 28th St
- 730 E 28th St
- 726 E 28th St
- 728 E 28th St
- 802 E 28th St
- 802 E 28th St Unit B
- 802 E 28th St Unit A
- 739 E 28th St
- 717 E 27th St
- 720 E 28th St
- 2714 Cornell St
- 806 E 28th St
- 735 E 28th St
- 717a E 27th St
- 715 E 27th St
- 2710 Cornell St
- 727 E 28th St
- 713 E 27th St
- 2706 Cornell St
Your Personal Tour Guide
Ask me questions while you tour the home.