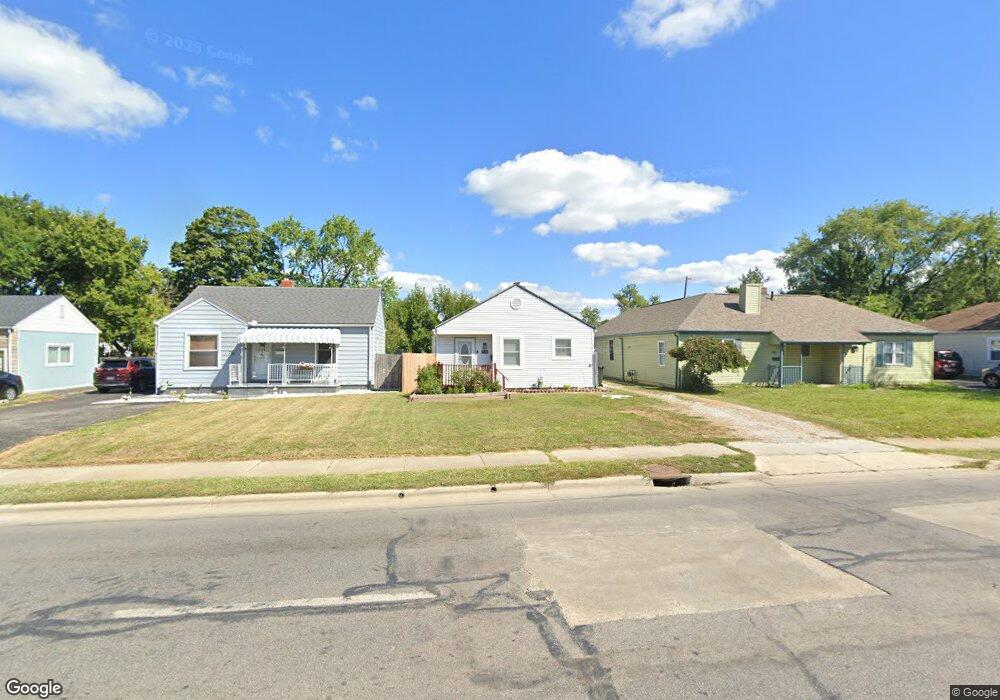
736 E Weber Rd Columbus, OH 43211
North Linden NeighborhoodEstimated Value: $114,000 - $183,000
2
Beds
1
Bath
704
Sq Ft
$210/Sq Ft
Est. Value
About This Home
This home is located at 736 E Weber Rd, Columbus, OH 43211 and is currently estimated at $147,740, approximately $209 per square foot. 736 E Weber Rd is a home located in Franklin County with nearby schools including Como Elementary School, Dominion Middle School, and Whetstone High School.
Ownership History
Date
Name
Owned For
Owner Type
Purchase Details
Closed on
Aug 29, 2019
Sold by
Straight Jesse
Bought by
Dipasquale Michael
Current Estimated Value
Home Financials for this Owner
Home Financials are based on the most recent Mortgage that was taken out on this home.
Original Mortgage
$120,772
Outstanding Balance
$108,063
Interest Rate
5.12%
Mortgage Type
FHA
Estimated Equity
$39,677
Purchase Details
Closed on
Jun 15, 2010
Sold by
Straight Wendy and Straight Edward
Bought by
Straight Jesse
Home Financials for this Owner
Home Financials are based on the most recent Mortgage that was taken out on this home.
Original Mortgage
$51,892
Interest Rate
5.25%
Mortgage Type
FHA
Purchase Details
Closed on
May 20, 2008
Sold by
Fifth Third Bank
Bought by
Straight Wendy
Purchase Details
Closed on
Feb 25, 2008
Sold by
Arrowood Harold W and Case #07Cve02 1673
Bought by
Fifth Third Bank
Purchase Details
Closed on
Dec 5, 1983
Bought by
Arrowood Harold W
Create a Home Valuation Report for This Property
The Home Valuation Report is an in-depth analysis detailing your home's value as well as a comparison with similar homes in the area
Home Values in the Area
Average Home Value in this Area
Purchase History
| Date | Buyer | Sale Price | Title Company |
|---|---|---|---|
| Dipasquale Michael | $123,000 | None Available | |
| Straight Jesse | $60,000 | Affinity T | |
| Straight Wendy | $18,000 | Attorney | |
| Fifth Third Bank | $24,000 | None Available | |
| Arrowood Harold W | $25,000 | -- |
Source: Public Records
Mortgage History
| Date | Status | Borrower | Loan Amount |
|---|---|---|---|
| Open | Dipasquale Michael | $120,772 | |
| Previous Owner | Straight Jesse | $51,892 |
Source: Public Records
Tax History
| Year | Tax Paid | Tax Assessment Tax Assessment Total Assessment is a certain percentage of the fair market value that is determined by local assessors to be the total taxable value of land and additions on the property. | Land | Improvement |
|---|---|---|---|---|
| 2025 | $1,918 | $42,740 | $9,770 | $32,970 |
| 2024 | $1,918 | $42,740 | $9,770 | $32,970 |
| 2023 | $1,894 | $42,735 | $9,765 | $32,970 |
| 2022 | $2,046 | $39,450 | $5,460 | $33,990 |
| 2021 | $2,050 | $39,450 | $5,460 | $33,990 |
| 2020 | $2,052 | $39,450 | $5,460 | $33,990 |
| 2019 | $1,068 | $17,610 | $4,550 | $13,060 |
| 2018 | $1,006 | $17,610 | $4,550 | $13,060 |
| 2017 | $1,068 | $17,610 | $4,550 | $13,060 |
| 2016 | $1,041 | $15,720 | $2,700 | $13,020 |
| 2015 | $945 | $15,720 | $2,700 | $13,020 |
| 2014 | $948 | $15,720 | $2,700 | $13,020 |
| 2013 | $549 | $18,480 | $3,150 | $15,330 |
Source: Public Records
Map
Nearby Homes
- 773 Melrose Ave
- 759 E Longview Ave
- 3035 Audubon Rd
- 2733 Beulah Rd
- 580 Crestview Rd
- 555 E Weber Rd
- 964 E Weber Rd
- 914 Weldon Ave
- 2593 Osceola Ave
- 2888 Howey Rd
- 2776 Howey Rd
- 2569 Audubon Rd
- 2836-2838 Indianola Ave Unit 2836
- 589 Clinton Heights Ave
- 2897 Grasmere Ave
- 2560 Osceola Ave
- 796 E Kenworth Rd
- 2874 Grasmere Ave
- 2593 Atwood Terrace
- 2950 Grasmere Ave
- 740 E Weber Rd
- 730 E Weber Rd
- 742 E Weber Rd
- 724 E Weber Rd
- 748 E Weber Rd
- 743 Melrose Ave
- 718 E Weber Rd
- 737 Melrose Ave
- 749 Melrose Ave
- 754 E Weber Rd
- 731 Melrose Ave
- 755 Melrose Ave
- 712 E Weber Rd
- 725 Melrose Ave
- 741 E Weber Rd
- 760 E Weber Rd
- 761 Melrose Ave
- 749 E Weber Rd
- 708 E Weber Rd
- 719 Melrose Ave
Your Personal Tour Guide
Ask me questions while you tour the home.