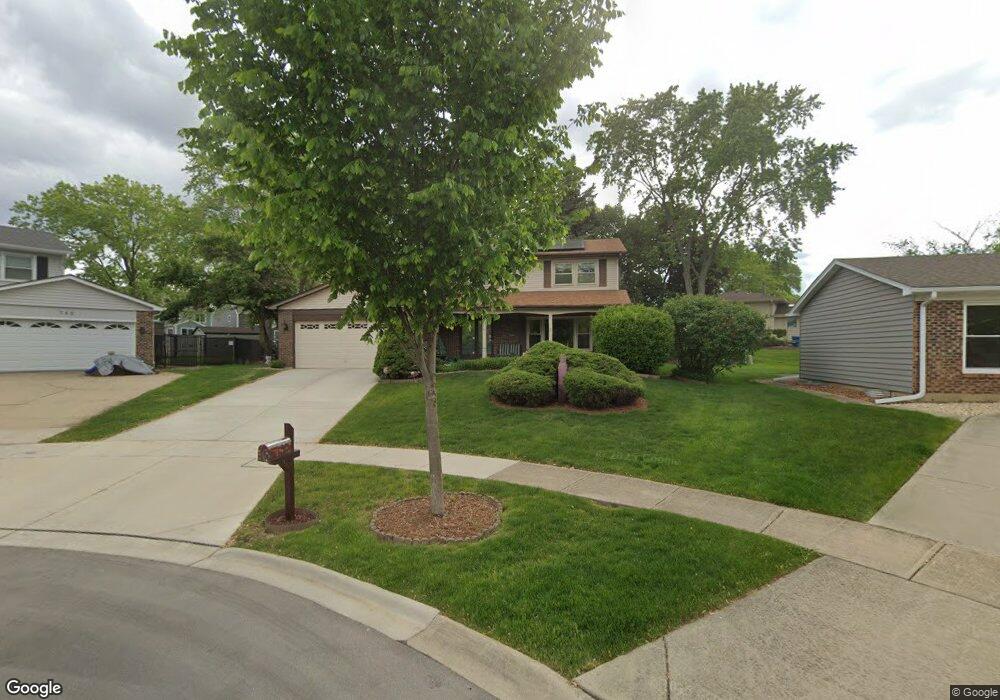
736 Fennel Ct Schaumburg, IL 60193
East Schaumburg NeighborhoodEstimated Value: $570,000 - $664,000
4
Beds
3
Baths
2,352
Sq Ft
$259/Sq Ft
Est. Value
About This Home
This home is located at 736 Fennel Ct, Schaumburg, IL 60193 and is currently estimated at $608,072, approximately $258 per square foot. 736 Fennel Ct is a home located in Cook County with nearby schools including Michael Collins Elementary School, Robert Frost Junior High School, and J B Conant High School.
Ownership History
Date
Name
Owned For
Owner Type
Purchase Details
Closed on
Apr 17, 2019
Sold by
Sloan Roberta A
Bought by
Roberta A Sloan Revocable Trust
Current Estimated Value
Home Financials for this Owner
Home Financials are based on the most recent Mortgage that was taken out on this home.
Original Mortgage
$275,000
Outstanding Balance
$240,283
Interest Rate
4%
Mortgage Type
New Conventional
Estimated Equity
$367,789
Purchase Details
Closed on
Aug 12, 2005
Sold by
Sloan Roberta Anne
Bought by
Sloan Roberta A and Roberta A Sloan Revocable Trust
Purchase Details
Closed on
Oct 13, 2004
Sold by
Scapes John N and Scapes Diane C
Bought by
Sloan Roberta Anne
Home Financials for this Owner
Home Financials are based on the most recent Mortgage that was taken out on this home.
Original Mortgage
$333,700
Interest Rate
5%
Mortgage Type
Unknown
Create a Home Valuation Report for This Property
The Home Valuation Report is an in-depth analysis detailing your home's value as well as a comparison with similar homes in the area
Home Values in the Area
Average Home Value in this Area
Purchase History
| Date | Buyer | Sale Price | Title Company |
|---|---|---|---|
| Roberta A Sloan Revocable Trust | -- | Amrock | |
| Sloan Roberta A | -- | Title Source Inc | |
| Sloan Roberta A | -- | -- | |
| Sloan Roberta Anne | $430,000 | Multiple |
Source: Public Records
Mortgage History
| Date | Status | Borrower | Loan Amount |
|---|---|---|---|
| Open | Sloan Roberta A | $275,000 | |
| Closed | Sloan Roberta Anne | $333,700 |
Source: Public Records
Tax History Compared to Growth
Tax History
| Year | Tax Paid | Tax Assessment Tax Assessment Total Assessment is a certain percentage of the fair market value that is determined by local assessors to be the total taxable value of land and additions on the property. | Land | Improvement |
|---|---|---|---|---|
| 2024 | $9,870 | $41,203 | $7,123 | $34,080 |
| 2023 | $9,520 | $41,203 | $7,123 | $34,080 |
| 2022 | $9,520 | $41,203 | $7,123 | $34,080 |
| 2021 | $7,429 | $30,507 | $5,341 | $25,166 |
| 2020 | $8,205 | $33,129 | $5,341 | $27,788 |
| 2019 | $8,212 | $36,811 | $5,341 | $31,470 |
| 2018 | $7,754 | $32,021 | $4,550 | $27,471 |
| 2017 | $6,772 | $33,926 | $4,550 | $29,376 |
| 2016 | $8,566 | $35,291 | $4,550 | $30,741 |
| 2015 | $8,310 | $32,275 | $3,957 | $28,318 |
| 2014 | $8,247 | $32,275 | $3,957 | $28,318 |
| 2013 | $8,005 | $32,275 | $3,957 | $28,318 |
Source: Public Records
Map
Nearby Homes
- 722 Merlin Dr Unit 16
- 718 N Point Dr
- 421 Summit Dr
- 916 Manchester Cir Unit 91A
- 126 Manchester Ct Unit 61B
- 1100 Boston Harbor Unit 7004
- 1871 Fox Run Dr Unit A
- 421 E Wise Rd
- 251 University Ln
- 263 Doral Ct Unit 1
- 36 Shore Dr
- 426 E Niagara Ave
- 205 Nantucket Harbor Unit 104
- 307 University Ln Unit A
- 1910 Baltimore Dr
- 1771 Vermont Dr
- 711 Tipperary Ct Unit 2D
- 712 Tipperary Ct Unit 1C
- 733 Limerick Ln Unit 7333D
- 826 Thornton Ct Unit 2AL
- 740 Fennel Ct Unit 9
- 732 Fennel Ct
- 737 Terrace Ct
- 733 Terrace Ct
- 728 Fennel Ct
- 741 Fennel Ct
- 729 Terrace Ct
- 741 Terrace Ct
- 737 Fennel Ct
- 733 Fennel Ct
- 512 Scholten Dr
- 508 Scholten Dr
- 500 Scholten Dr
- 516 Scholten Dr
- 504 Scholten Dr
- 729 Fennel Ct
- 520 Scholten Dr
- 740 Terrace Ct
- 725 Fennel Ct
- 736 Terrace Ct