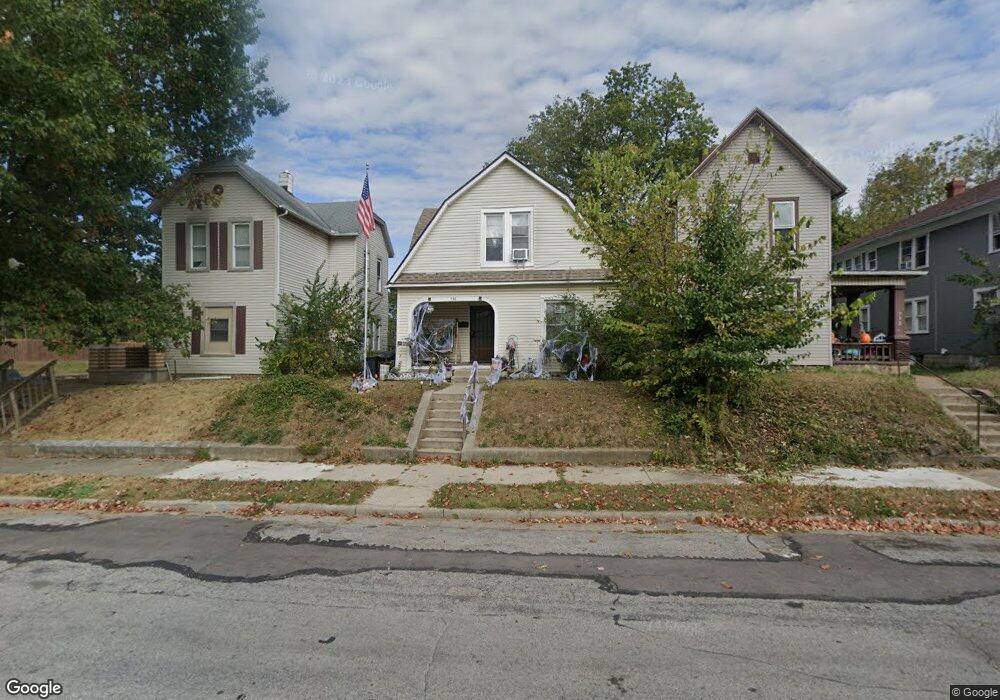
736 Grant St Springfield, OH 45504
Estimated Value: $50,000 - $173,000
3
Beds
2
Baths
1,350
Sq Ft
$75/Sq Ft
Est. Value
About This Home
This home is located at 736 Grant St, Springfield, OH 45504 and is currently estimated at $100,995, approximately $74 per square foot. 736 Grant St is a home located in Clark County with nearby schools including Snyder Park Elementary School, Roosevelt Middle School, and Springfield High School.
Ownership History
Date
Name
Owned For
Owner Type
Purchase Details
Closed on
Mar 28, 2016
Sold by
Gladman Malissa K
Bought by
Gwaltney Dorreen J
Current Estimated Value
Home Financials for this Owner
Home Financials are based on the most recent Mortgage that was taken out on this home.
Original Mortgage
$26,092
Outstanding Balance
$20,708
Interest Rate
3.65%
Mortgage Type
New Conventional
Estimated Equity
$80,287
Purchase Details
Closed on
Feb 27, 2012
Sold by
Fifth Third Mortgage Company
Bought by
Gladman Malissa K
Purchase Details
Closed on
Sep 12, 2011
Sold by
Martindale Brent A and Martindale Brent Arthur
Bought by
Fifth Third Mortgage Company
Purchase Details
Closed on
Jan 25, 2005
Sold by
Federal National Mortgage Association
Bought by
Martindale Brent A
Purchase Details
Closed on
Aug 18, 2004
Sold by
Rush Lisa M
Bought by
Federal National Mortgage Association
Purchase Details
Closed on
Jul 9, 1996
Sold by
Aultman Elizabeth C
Bought by
Rush Lisa
Create a Home Valuation Report for This Property
The Home Valuation Report is an in-depth analysis detailing your home's value as well as a comparison with similar homes in the area
Home Values in the Area
Average Home Value in this Area
Purchase History
| Date | Buyer | Sale Price | Title Company |
|---|---|---|---|
| Gwaltney Dorreen J | $29,000 | Team Title & Closing Service | |
| Gladman Malissa K | $12,000 | Prism Title & Closing Servic | |
| Fifth Third Mortgage Company | $23,334 | None Available | |
| Martindale Brent A | $15,100 | -- | |
| Federal National Mortgage Association | $12,000 | -- | |
| Rush Lisa | $27,000 | -- |
Source: Public Records
Mortgage History
| Date | Status | Borrower | Loan Amount |
|---|---|---|---|
| Open | Gwaltney Dorreen J | $26,092 |
Source: Public Records
Tax History Compared to Growth
Tax History
| Year | Tax Paid | Tax Assessment Tax Assessment Total Assessment is a certain percentage of the fair market value that is determined by local assessors to be the total taxable value of land and additions on the property. | Land | Improvement |
|---|---|---|---|---|
| 2024 | $658 | $13,650 | $3,380 | $10,270 |
| 2023 | $658 | $13,650 | $3,380 | $10,270 |
| 2022 | $674 | $13,650 | $3,380 | $10,270 |
| 2021 | $603 | $11,280 | $2,800 | $8,480 |
| 2020 | $605 | $11,280 | $2,800 | $8,480 |
| 2019 | $606 | $11,280 | $2,800 | $8,480 |
| 2018 | $638 | $11,400 | $3,290 | $8,110 |
| 2017 | $637 | $11,400 | $3,290 | $8,110 |
| 2016 | $638 | $11,400 | $3,290 | $8,110 |
| 2015 | $685 | $12,002 | $3,290 | $8,712 |
| 2014 | $682 | $12,002 | $3,290 | $8,712 |
| 2013 | $674 | $12,002 | $3,290 | $8,712 |
Source: Public Records
Map
Nearby Homes
- 423 N Jackson St Unit 425
- 222 N Race St Unit 224
- 522 W North St Unit 524
- 101`103 N Western
- 366 N Isabella St
- 1120 W High St
- 1009 W High St
- 0 S Plum St
- 1205 W High St
- 1420 Parker Ct
- 1009 N Lowry Ave
- 120 E Ward St
- 681 W Jefferson St Unit 683
- 1015 Hillcrest Ave
- 1222 Beverly Ave
- 833 W Mulberry St
- 40 Zischler St
- 20 N Center St
- 317 S Plum St
- 25 Mill Run Place
- 732 Grant St
- 740 Grant St
- 728 Grant St Unit 730
- 518 N Shaffer St
- 724 Grant St
- 802 Grant St
- 524 N Shaffer St
- 720 Grant St
- 428 N Shaffer St
- 806 Grant St
- 530 N Shaffer St
- 521 N Shaffer St Unit 523
- 716 Grant St
- 424 N Shaffer St
- 721 Rubsam St
- 725 Grant St
- 810 Grant St Unit 812
- 723 Grant St
- 517 N Shaffer St
- 427 N Shaffer St Unit 429