Estimated Value: $118,000 - $271,000
3
Beds
2
Baths
2,533
Sq Ft
$82/Sq Ft
Est. Value
About This Home
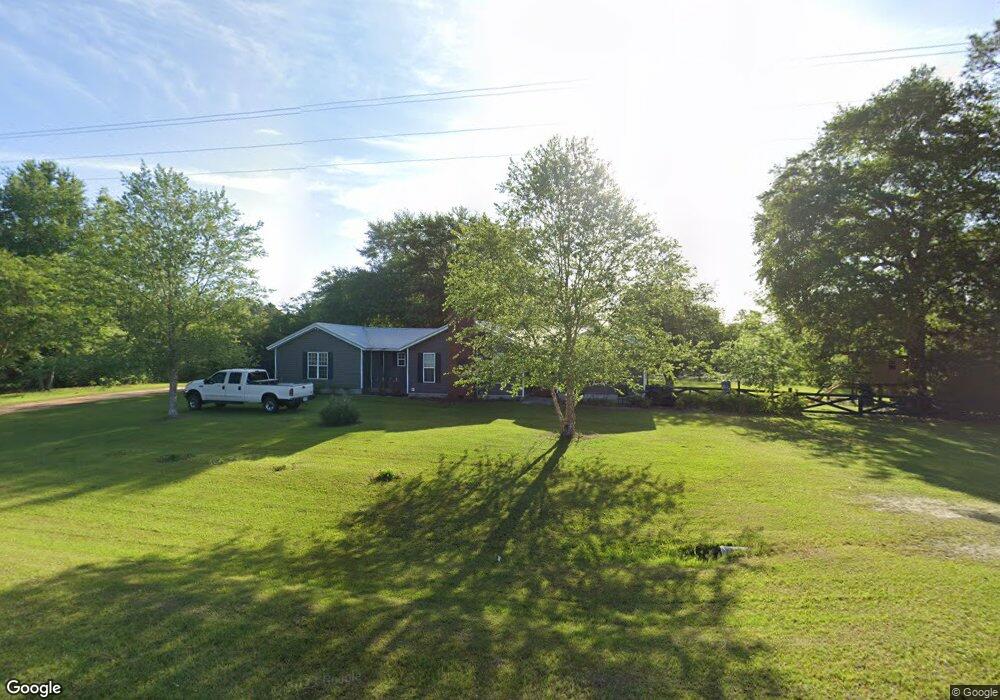
This home is located at 736 Hall Whitley Rd, Lenox, GA 31637 and is currently estimated at $208,009, approximately $82 per square foot. 736 Hall Whitley Rd is a home located in Berrien County with nearby schools including Berrien Primary School, Berrien Elementary School, and Berrien Middle School.
Ownership History
Date
Name
Owned For
Owner Type
Purchase Details
Closed on
Feb 18, 2011
Sold by
Mccorvey Homes Llc
Bought by
Guess Mark A and Guess Amanda F
Current Estimated Value
Home Financials for this Owner
Home Financials are based on the most recent Mortgage that was taken out on this home.
Original Mortgage
$129,533
Outstanding Balance
$88,341
Interest Rate
4.71%
Mortgage Type
New Conventional
Estimated Equity
$119,668
Purchase Details
Closed on
Apr 20, 2009
Sold by
Hendrix Rei Llc
Bought by
Mccorvey Homes Llc
Purchase Details
Closed on
Apr 9, 2009
Sold by
Secretary Of Housing & Urban Development
Bought by
Hendrix Rei Llc
Purchase Details
Closed on
Nov 7, 2006
Sold by
Lingefelt William and Lingefelt Barbara
Bought by
Midfirst Bank
Purchase Details
Closed on
Nov 3, 1994
Bought by
Lingefelt William H
Purchase Details
Closed on
Oct 21, 1993
Bought by
Leslie White
Create a Home Valuation Report for This Property
The Home Valuation Report is an in-depth analysis detailing your home's value as well as a comparison with similar homes in the area
Home Values in the Area
Average Home Value in this Area
Purchase History
| Date | Buyer | Sale Price | Title Company |
|---|---|---|---|
| Guess Mark A | $125,000 | -- | |
| Mccorvey Homes Llc | $17,500 | -- | |
| Hendrix Rei Llc | $13,803 | -- | |
| Midfirst Bank | -- | -- | |
| Sec Of Housing A & Urban | $69,035 | -- | |
| Sec Of Housing & Urban | $69,035 | -- | |
| Midfirst Bank | $69,035 | -- | |
| Lingefelt William H | $68,700 | -- | |
| Leslie White | $22,700 | -- |
Source: Public Records
Mortgage History
| Date | Status | Borrower | Loan Amount |
|---|---|---|---|
| Open | Guess Mark A | $129,533 |
Source: Public Records
Tax History Compared to Growth
Tax History
| Year | Tax Paid | Tax Assessment Tax Assessment Total Assessment is a certain percentage of the fair market value that is determined by local assessors to be the total taxable value of land and additions on the property. | Land | Improvement |
|---|---|---|---|---|
| 2024 | $1,419 | $45,347 | $2,000 | $43,347 |
| 2023 | $1,426 | $45,347 | $2,000 | $43,347 |
| 2022 | $1,426 | $45,347 | $2,000 | $43,347 |
| 2021 | $1,435 | $45,347 | $2,000 | $43,347 |
| 2020 | $1,438 | $45,347 | $2,000 | $43,347 |
| 2019 | $1,438 | $45,347 | $2,000 | $43,347 |
| 2018 | $1,397 | $45,347 | $2,000 | $43,347 |
| 2017 | $1,438 | $45,347 | $2,000 | $43,347 |
| 2016 | $1,397 | $45,347 | $2,000 | $43,347 |
| 2015 | -- | $45,347 | $2,000 | $43,347 |
| 2014 | -- | $45,347 | $2,000 | $43,347 |
| 2013 | -- | $45,347 | $2,000 | $43,347 |
Source: Public Records
Map
Nearby Homes
- 69 Branch Ln
- 2635 Brookfield-Lenox Rd
- 0 E 0 Hwy 125 S
- 720 Vanceville County Line Rd
- 0 Baker Rd
- 58 Honeysuckle Ln
- 287 Brookfield Nashville Rd
- 204 Brookfield Nashville Rd
- 86 Owen Medford Rd
- 21 Brookfield-Lenox Rd
- 320 E Central Ave
- 77 S Bobby St
- 3365 Chula Brookfield Rd
- 39 Paradise Lake Rd
- 801 Broad St
- 0 Nashville Enigma Rd
- 5 Paradise Lake Rd
- 2242 U S 82
- 411 S Robinson St
- 83 W Gray Ave
- 778 Hall Whitley Rd
- 1061 Hall Whitley Rd
- 936 Hall Whitley Rd
- 992 Hall Whitley Rd
- 188 Hillard Weeks Rd
- 861 Parker Chapel Rd
- 735 Parker Chapel Rd
- 320 Hillard Weeks Rd
- 52 Buck Bennett Rd
- 12624 Sr 125 N
- 1004 Parker Chapel Rd
- 222 Calvin Williams Rd
- 401 Hillard Weeks Rd
- 375 Hillard Weeks Rd
- 120 Buck Bennett Rd
- 12774 Sr 125 N
- 171 Hall Whitley Rd
- 509 Hillard Weeks Rd
- 1298 Hall Whitley Rd
- 101 Osborne Griner Rd