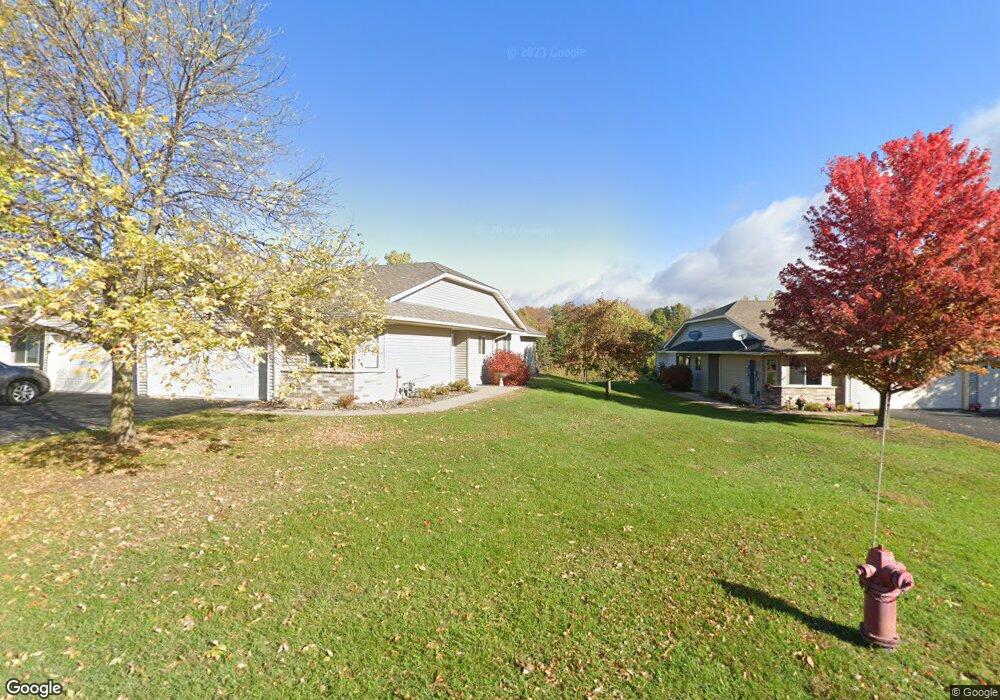
736 Highview Ct Saint Croix Falls, WI 54024
Estimated Value: $286,627 - $306,000
2
Beds
2
Baths
1,256
Sq Ft
$234/Sq Ft
Est. Value
About This Home
This home is located at 736 Highview Ct, Saint Croix Falls, WI 54024 and is currently estimated at $293,407, approximately $233 per square foot. 736 Highview Ct is a home located in Polk County with nearby schools including Saint Croix Falls Elementary School, Dresser Elementary School, and Saint Croix Falls Middle School.
Ownership History
Date
Name
Owned For
Owner Type
Purchase Details
Closed on
Sep 22, 2020
Sold by
Edling Judith M and Edling Steven J
Bought by
Pearson Skipper J and Pearson Gloria J
Current Estimated Value
Home Financials for this Owner
Home Financials are based on the most recent Mortgage that was taken out on this home.
Original Mortgage
$141,200
Outstanding Balance
$125,306
Interest Rate
2.9%
Mortgage Type
New Conventional
Estimated Equity
$168,101
Purchase Details
Closed on
Dec 28, 2018
Sold by
John B Edling Estate
Bought by
Edling Rayola A
Purchase Details
Closed on
Nov 15, 2005
Sold by
Edling Revoc Tr /Tr
Bought by
Edling John B and Edling Rayola A
Purchase Details
Closed on
Aug 24, 2005
Sold by
National Builders Inc
Bought by
Edling John B and Edling Rayola A
Create a Home Valuation Report for This Property
The Home Valuation Report is an in-depth analysis detailing your home's value as well as a comparison with similar homes in the area
Home Values in the Area
Average Home Value in this Area
Purchase History
| Date | Buyer | Sale Price | Title Company |
|---|---|---|---|
| Pearson Skipper J | $135,600 | Title One Premier Group Inc | |
| Pearson Skipper J | $45,200 | Title One Premier Group Inc | |
| Edling Rayola A | -- | None Available | |
| Edling John B | -- | -- | |
| Edling John B | -- | -- | |
| Edling John B | $140,100 | -- | |
| National Builders Inc | -- | -- |
Source: Public Records
Mortgage History
| Date | Status | Borrower | Loan Amount |
|---|---|---|---|
| Open | Pearson Skipper J | $141,200 | |
| Closed | National Builders Inc | $0 |
Source: Public Records
Tax History Compared to Growth
Tax History
| Year | Tax Paid | Tax Assessment Tax Assessment Total Assessment is a certain percentage of the fair market value that is determined by local assessors to be the total taxable value of land and additions on the property. | Land | Improvement |
|---|---|---|---|---|
| 2024 | $3,471 | $252,000 | $25,000 | $227,000 |
| 2023 | $1,968 | $107,900 | $19,600 | $88,300 |
| 2022 | $2,214 | $107,900 | $19,600 | $88,300 |
| 2021 | $2,131 | $107,900 | $19,600 | $88,300 |
| 2020 | $2,383 | $107,900 | $19,600 | $88,300 |
| 2019 | $2,216 | $107,900 | $19,600 | $88,300 |
| 2018 | $2,430 | $107,900 | $19,600 | $88,300 |
| 2017 | $2,090 | $107,900 | $19,600 | $88,300 |
| 2016 | $2,065 | $107,900 | $19,600 | $88,300 |
| 2015 | $2,171 | $107,900 | $19,600 | $88,300 |
| 2013 | $2,167 | $114,700 | $17,700 | $97,000 |
| 2012 | $2,174 | $114,700 | $17,700 | $97,000 |
Source: Public Records
Map
Nearby Homes
- 735 Highview Ct
- 730 Highview Ct
- 338 S Jefferson St
- 8xx E Louisiana St
- 226 N Madison St
- 221 N Jefferson St
- 120 E Maryland St
- 631 Bench St
- 447 Woodale Ave
- 1301 Aspen Dr
- 1305 E Aspen Dr
- 1309 E Aspen Dr
- 1315 Green Tree Dr
- 1319 Woodale Ct
- 1317 E Aspen Dr
- TBD Folsom St
- 1321 E Aspen Dr
- 1329 E Aspen Dr
- 1334 E Aspen Dr
- 1333 E Aspen Dr
- 738 Highview Ct
- 734 Highview Ct
- 732 Highview Ct
- 740 Highview Ct
- 728 Highview Ct
- 733 Highview Ct
- 731 Highview Ct
- 737 Highview Ct
- 729 Highview Ct
- 726 Highview Ct
- 739 Highview Ct
- 727 Highview Ct
- 741 Highview Ct
- 724 Highview Ct
- 715 Overlook Ct
- 713 Overlook Ct
- 720 Highview Ct
- 716 Overlook Ct
- 711 Overlook Ct
- 714 Overlook Ct