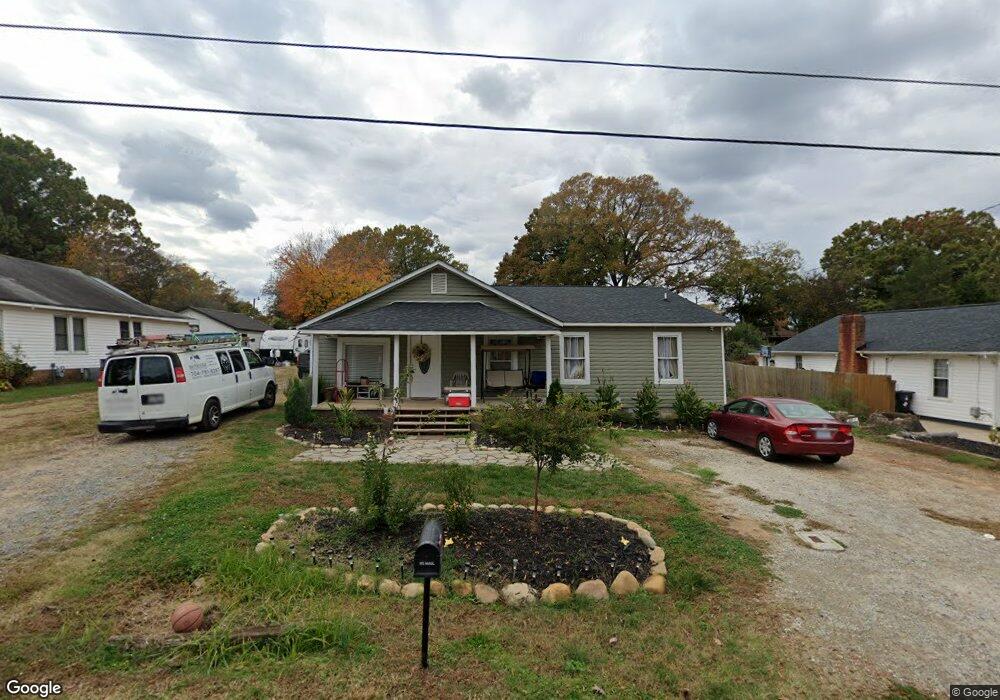
736 Main St SW Concord, NC 28027
Estimated Value: $236,000 - $301,185
5
Beds
3
Baths
1,632
Sq Ft
$166/Sq Ft
Est. Value
About This Home
This home is located at 736 Main St SW, Concord, NC 28027 and is currently estimated at $270,546, approximately $165 per square foot. 736 Main St SW is a home located in Cabarrus County with nearby schools including Wolf Meadow Elementary School, J.N. Fries Middle School, and Branch Christian Academy.
Ownership History
Date
Name
Owned For
Owner Type
Purchase Details
Closed on
Oct 10, 2019
Sold by
Kennedy Gary A and Kennedy Susan E
Bought by
Rosario Virginia and Rosario Jose Jonathan
Current Estimated Value
Purchase Details
Closed on
May 23, 2002
Sold by
Estate Of Mable Lucille Mckinney
Bought by
Mann Robert Lee
Home Financials for this Owner
Home Financials are based on the most recent Mortgage that was taken out on this home.
Original Mortgage
$52,000
Interest Rate
7.07%
Purchase Details
Closed on
Apr 25, 2002
Sold by
Newell Jeffery G and Newell Pennie L
Bought by
Kennedy Gary Alan and Kennedy Susan E
Home Financials for this Owner
Home Financials are based on the most recent Mortgage that was taken out on this home.
Original Mortgage
$52,000
Interest Rate
7.07%
Purchase Details
Closed on
Jul 11, 2000
Sold by
Newell Richard Franklyn and Newell Linda C
Bought by
Newell Jeffrey Glenn
Purchase Details
Closed on
Jan 1, 1990
Bought by
Newell Jeffery G and Newell Wife
Purchase Details
Closed on
Jul 1, 1986
Create a Home Valuation Report for This Property
The Home Valuation Report is an in-depth analysis detailing your home's value as well as a comparison with similar homes in the area
Home Values in the Area
Average Home Value in this Area
Purchase History
| Date | Buyer | Sale Price | Title Company |
|---|---|---|---|
| Rosario Virginia | $65,000 | None Available | |
| Mann Robert Lee | $40,500 | -- | |
| Kennedy Gary Alan | $65,000 | -- | |
| Newell Jeffrey Glenn | -- | -- | |
| Newell Jeffery G | $35,000 | -- | |
| -- | $23,000 | -- |
Source: Public Records
Mortgage History
| Date | Status | Borrower | Loan Amount |
|---|---|---|---|
| Previous Owner | Kennedy Gary Alan | $52,000 |
Source: Public Records
Tax History Compared to Growth
Tax History
| Year | Tax Paid | Tax Assessment Tax Assessment Total Assessment is a certain percentage of the fair market value that is determined by local assessors to be the total taxable value of land and additions on the property. | Land | Improvement |
|---|---|---|---|---|
| 2025 | $2,764 | $277,480 | $50,000 | $227,480 |
| 2024 | $2,764 | $277,480 | $50,000 | $227,480 |
| 2023 | $2,063 | $169,120 | $22,000 | $147,120 |
| 2022 | $2,063 | $120,650 | $22,000 | $98,650 |
| 2021 | $1,472 | $120,650 | $22,000 | $98,650 |
| 2020 | $582 | $47,690 | $22,000 | $25,690 |
| 2019 | $792 | $64,930 | $14,000 | $50,930 |
| 2018 | $779 | $64,930 | $14,000 | $50,930 |
| 2017 | $766 | $64,930 | $14,000 | $50,930 |
| 2016 | $455 | $64,530 | $15,000 | $49,530 |
| 2015 | $761 | $64,530 | $15,000 | $49,530 |
| 2014 | $761 | $64,530 | $15,000 | $49,530 |
Source: Public Records
Map
Nearby Homes
- 758 Main St SW
- 782 Chalice St SW
- 809 Fargo Dr SW
- 64 Robinson Dr SW
- 82 Highland Ave SW
- 84 Highland Ave SW
- Lot #2 Faith Dr SW
- 933 Old Charlotte Rd
- 2893 Signal Ct SW
- 368 Office Dr SW
- 207 Highland Ave SW
- 609 Faith Dr SW Unit 1
- 1067 Old Charlotte Rd
- 220 Highland Ave SW
- 2824 Trestle Ct SW
- 41 Fleetwood Dr SW
- 664 Jackson Terrace SW
- 668 Jackson Terrace SW
- 1015 Rockland Cir SW
- 620 Palmer Ave SW
- 732 Main St SW
- 748 Main St SW
- 741 Chalice St SW
- 735 Main St SW
- 737 Chalice St SW
- 724 Main St SW
- 733 Chalice St SW Unit 25
- 733 Chalice St SW
- 752 Main St SW
- 745 Chalice St SW
- 747 Main St SW
- 673 Union Cemetery Rd SW
- 673 Union Cemetery Rd SW Unit 8
- 667 Union Cemetery Rd SW
- 721 Main St SW
- 736 Chalice St SW
- 757 Main St SW
- 718 Main St SW
- 497 Short St SW
- 659 Union Cemetery Rd SW