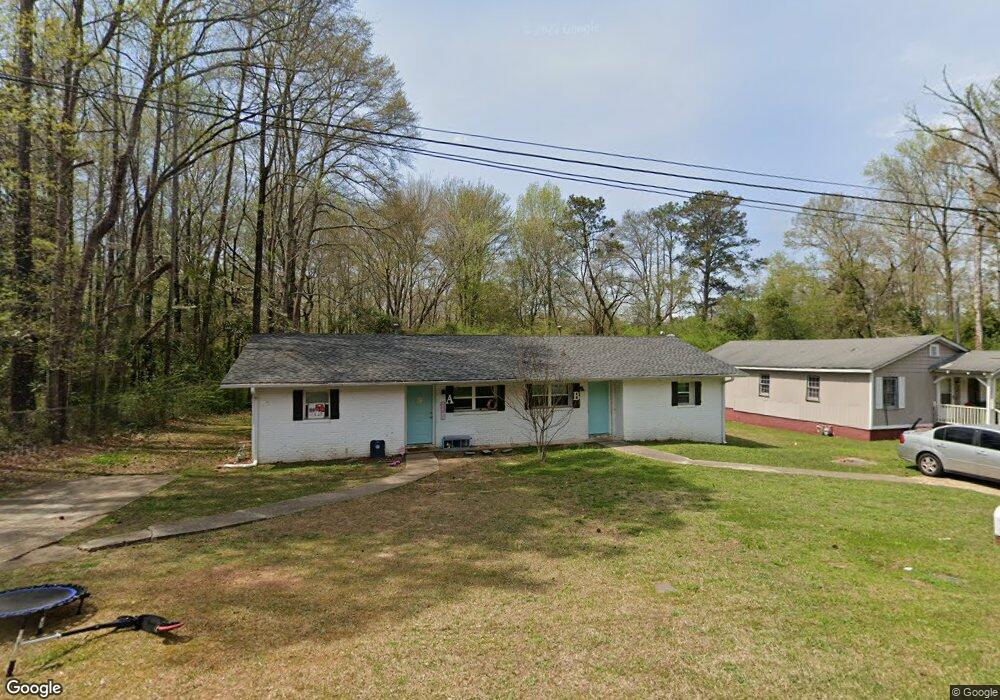
736 Matthews St Unit A Lagrange, GA 30241
Estimated Value: $183,000 - $190,641
2
Beds
1
Bath
657
Sq Ft
$286/Sq Ft
Est. Value
About This Home
This home is located at 736 Matthews St Unit A, Lagrange, GA 30241 and is currently estimated at $187,660, approximately $285 per square foot. 736 Matthews St Unit A is a home located in Troup County with nearby schools including Callaway Elementary School, Hogansville Elementary School, and Callaway Middle School.
Ownership History
Date
Name
Owned For
Owner Type
Purchase Details
Closed on
May 2, 2022
Sold by
Hays Matthew R
Bought by
Bowles Robert Lindsey
Current Estimated Value
Home Financials for this Owner
Home Financials are based on the most recent Mortgage that was taken out on this home.
Original Mortgage
$124,500
Outstanding Balance
$116,765
Interest Rate
4.42%
Mortgage Type
New Conventional
Estimated Equity
$70,895
Purchase Details
Closed on
Apr 8, 2019
Sold by
Paige Ralph M
Bought by
Hays Matthew R
Purchase Details
Closed on
Nov 12, 1981
Sold by
Paige Ralph M
Bought by
Paige Bernice
Purchase Details
Closed on
Jun 23, 1981
Sold by
Commercial Bank & Trust
Bought by
Paige Ralph M
Purchase Details
Closed on
Jun 22, 1981
Sold by
Citizens & Southern Bank
Bought by
Commercial Bank & Trust
Purchase Details
Closed on
Nov 6, 1980
Sold by
Commercial Bank & Trust
Bought by
Citizens & Southern Bank
Purchase Details
Closed on
Jan 1, 1971
Bought by
Commercial Bank & Trust
Create a Home Valuation Report for This Property
The Home Valuation Report is an in-depth analysis detailing your home's value as well as a comparison with similar homes in the area
Purchase History
| Date | Buyer | Sale Price | Title Company |
|---|---|---|---|
| Bowles Robert Lindsey | $147,000 | -- | |
| Hays Matthew R | $40,000 | -- | |
| Paige Bernice | -- | -- | |
| Paige Ralph M | -- | -- | |
| Commercial Bank & Trust | -- | -- | |
| Citizens & Southern Bank | -- | -- | |
| Commercial Bank & Trust | -- | -- |
Source: Public Records
Mortgage History
| Date | Status | Borrower | Loan Amount |
|---|---|---|---|
| Open | Bowles Robert Lindsey | $124,500 |
Source: Public Records
Tax History
| Year | Tax Paid | Tax Assessment Tax Assessment Total Assessment is a certain percentage of the fair market value that is determined by local assessors to be the total taxable value of land and additions on the property. | Land | Improvement |
|---|---|---|---|---|
| 2025 | $1,886 | $69,160 | $4,640 | $64,520 |
| 2024 | $1,756 | $64,400 | $4,640 | $59,760 |
| 2023 | $1,552 | $56,920 | $4,640 | $52,280 |
| 2022 | $1,548 | $55,480 | $4,640 | $50,840 |
| 2021 | $770 | $25,520 | $4,640 | $20,880 |
| 2020 | $770 | $25,520 | $4,640 | $20,880 |
| 2019 | $711 | $23,560 | $4,640 | $18,920 |
| 2018 | $675 | $22,368 | $3,448 | $18,920 |
| 2017 | $675 | $22,368 | $3,448 | $18,920 |
| 2016 | $656 | $21,737 | $3,448 | $18,289 |
| 2015 | $657 | $21,737 | $3,448 | $18,289 |
| 2014 | $655 | $21,650 | $3,448 | $18,202 |
| 2013 | -- | $23,097 | $3,448 | $19,649 |
Source: Public Records
Map
Nearby Homes
- 0 Kelley St Unit 10550311
- 957 Kelley St
- 1017 Mason St
- 626 Smoot St
- 510 Smoot St
- 0 Brown St Unit 10550761
- 0 Brown St Unit 10550754
- 137 Edgewood Ave
- LOT 15 Edgewood Ave
- 459 Merrywood Dr
- 0 E Fendig St
- 113 E Fendig St
- 200 Mccall St
- 203 Revis St
- 205 Revis St
- 901 Whiteline St
- 0 Burr St
- 306 Burr St
- 114 Brenda Blvd
- 130 Edgewood Ave
- 736 Matthews St
- 738 Matthews St
- 737 Matthews St
- 735 Matthews St
- 739 Matthews St
- 743 Matthews St
- 730 Matthews St
- 745 Matthews St
- 748 Matthews St
- 749 Matthews St
- 723 Glenn Robertson Dr
- 752 Matthews St
- 747 Glenn Robertson Dr
- 751 Matthews St
- 721 Glenn Robertson Dr
- 753 Matthews St
- 719 1/2 Glenn Robertson Dr
- 719 Glenn Robertson Dr
- 740 Glenn Robertson Dr
- 709 Colquitt St
Your Personal Tour Guide
Ask me questions while you tour the home.