Estimated Value: $917,000 - $1,144,005
5
Beds
3
Baths
2,663
Sq Ft
$377/Sq Ft
Est. Value
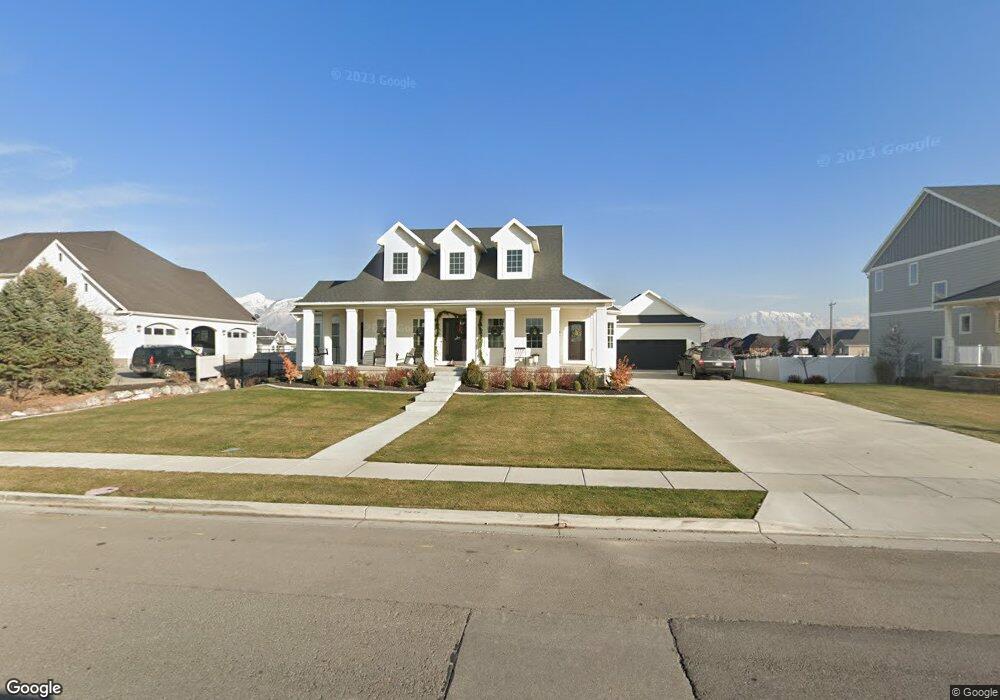
About This Home
This home is located at 736 N 2375 W, Lehi, UT 84043 and is currently estimated at $1,005,001, approximately $377 per square foot. 736 N 2375 W is a home with nearby schools including River Rock Elementary, Willowcreek Middle School, and Lehi High School.
Ownership History
Date
Name
Owned For
Owner Type
Purchase Details
Closed on
Jul 15, 2024
Sold by
Sabey Steven Craig and Sabey Elsie Anne
Bought by
Sabey Family Trust and Sabey
Current Estimated Value
Purchase Details
Closed on
Aug 12, 2020
Sold by
Sabey Steven Craig
Bought by
Sabey Steven Craig and Sabey Elsie Anne
Home Financials for this Owner
Home Financials are based on the most recent Mortgage that was taken out on this home.
Original Mortgage
$406,670
Interest Rate
3%
Mortgage Type
New Conventional
Purchase Details
Closed on
Jan 22, 2016
Sold by
May Douglas J and May Clydene C
Bought by
Sabey Steven Craig and Sabey Elsie Anne
Home Financials for this Owner
Home Financials are based on the most recent Mortgage that was taken out on this home.
Original Mortgage
$111,200
Interest Rate
3.93%
Mortgage Type
New Conventional
Create a Home Valuation Report for This Property
The Home Valuation Report is an in-depth analysis detailing your home's value as well as a comparison with similar homes in the area
Home Values in the Area
Average Home Value in this Area
Purchase History
| Date | Buyer | Sale Price | Title Company |
|---|---|---|---|
| Sabey Family Trust | -- | None Listed On Document | |
| Sabey Steven Craig | -- | Inwest Title Services Inc | |
| Sabey Steven Craig | -- | Inwest Title Services Inc | |
| Sabey Steven Craig | -- | Inwest Title |
Source: Public Records
Mortgage History
| Date | Status | Borrower | Loan Amount |
|---|---|---|---|
| Previous Owner | Sabey Steven Craig | $406,670 | |
| Previous Owner | Sabey Steven Craig | $111,200 |
Source: Public Records
Tax History Compared to Growth
Tax History
| Year | Tax Paid | Tax Assessment Tax Assessment Total Assessment is a certain percentage of the fair market value that is determined by local assessors to be the total taxable value of land and additions on the property. | Land | Improvement |
|---|---|---|---|---|
| 2025 | $4,060 | $533,720 | $347,800 | $622,600 |
| 2024 | $4,060 | $475,145 | $0 | $0 |
| 2023 | $3,834 | $487,190 | $0 | $0 |
| 2022 | $3,819 | $470,470 | $0 | $0 |
| 2021 | $3,415 | $636,000 | $201,200 | $434,800 |
| 2020 | $3,220 | $592,700 | $186,300 | $406,400 |
| 2019 | $2,853 | $545,900 | $186,300 | $359,600 |
| 2018 | $2,611 | $472,400 | $159,700 | $312,700 |
| 2017 | $2,437 | $234,410 | $0 | $0 |
| 2016 | $417 | $37,200 | $0 | $0 |
| 2015 | $3 | $250 | $0 | $0 |
| 2014 | $3 | $250 | $0 | $0 |
Source: Public Records
Map
Nearby Homes
- 2512 W 610 N Unit 99
- 373 N Willow Haven Ave
- 1302 N 2450 W
- 122 N 2430 W Unit 1
- Accord Plan at Riverwalk
- Interlude Plan at Riverwalk
- Trio Plan at Riverwalk
- Fortissimo Plan at Riverwalk
- Ballad Plan at Riverwalk
- Tenor Plan at Riverwalk
- Madrigal Plan at Riverwalk
- Timpani Plan at Riverwalk
- Canon Plan at Riverwalk
- Browning Plan at Riverwalk
- Octave Plan at Riverwalk
- Adagio Plan at Riverwalk
- Bravo Plan at Riverwalk
- Princeton Plan at Riverwalk
- Anthem Plan at Riverwalk
- Yalecrest Plan at Riverwalk