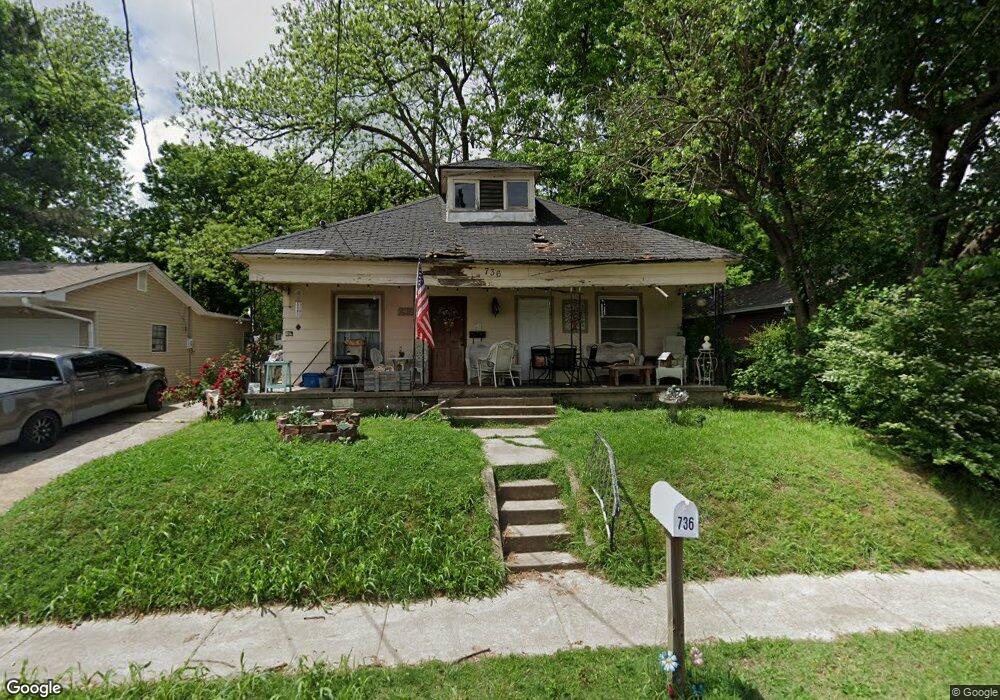
736 N Pruett St Paragould, AR 72450
Estimated Value: $66,251 - $110,000
2
Beds
1
Bath
938
Sq Ft
$86/Sq Ft
Est. Value
About This Home
This home is located at 736 N Pruett St, Paragould, AR 72450 and is currently estimated at $80,563, approximately $85 per square foot. 736 N Pruett St is a home located in Greene County with nearby schools including Paragould High School and St. Mary's Catholic School & Preschool.
Ownership History
Date
Name
Owned For
Owner Type
Purchase Details
Closed on
Jul 28, 2008
Sold by
Chapmon Alvin P and Chapmon Marla G
Bought by
Moss Russell H and Moss Joan S
Current Estimated Value
Purchase Details
Closed on
Jul 18, 2006
Sold by
Cantrell Jerry and Cantrell Jean
Bought by
Delmont Bobby and Delmont Phyllis
Home Financials for this Owner
Home Financials are based on the most recent Mortgage that was taken out on this home.
Original Mortgage
$28,605
Interest Rate
6.6%
Mortgage Type
Construction
Purchase Details
Closed on
Aug 31, 2005
Sold by
Chapmon Alvin P and Chapmon Marla G
Bought by
Chapmon Alvin P and Chapmon Marla G
Home Financials for this Owner
Home Financials are based on the most recent Mortgage that was taken out on this home.
Original Mortgage
$20,508
Interest Rate
8%
Mortgage Type
Construction
Purchase Details
Closed on
Feb 25, 1997
Bought by
Jordan Properties Ltd
Purchase Details
Closed on
Dec 6, 1994
Bought by
Melodie J Philhours
Create a Home Valuation Report for This Property
The Home Valuation Report is an in-depth analysis detailing your home's value as well as a comparison with similar homes in the area
Home Values in the Area
Average Home Value in this Area
Purchase History
| Date | Buyer | Sale Price | Title Company |
|---|---|---|---|
| Moss Russell H | $31,000 | None Available | |
| Delmont Bobby | -- | None Available | |
| Chapmon Alvin P | -- | None Available | |
| Jordan Properties Ltd | -- | -- | |
| Melodie J Philhours | -- | -- |
Source: Public Records
Mortgage History
| Date | Status | Borrower | Loan Amount |
|---|---|---|---|
| Previous Owner | Delmont Bobby | $28,605 | |
| Previous Owner | Chapmon Alvin P | $20,508 |
Source: Public Records
Tax History Compared to Growth
Tax History
| Year | Tax Paid | Tax Assessment Tax Assessment Total Assessment is a certain percentage of the fair market value that is determined by local assessors to be the total taxable value of land and additions on the property. | Land | Improvement |
|---|---|---|---|---|
| 2024 | $282 | $9,660 | $2,000 | $7,660 |
| 2023 | $282 | $6,130 | $1,200 | $4,930 |
| 2022 | $282 | $6,130 | $1,200 | $4,930 |
| 2021 | $232 | $6,130 | $1,200 | $4,930 |
| 2020 | $221 | $4,810 | $1,200 | $3,610 |
| 2019 | $221 | $4,810 | $1,200 | $3,610 |
| 2018 | $215 | $4,810 | $1,200 | $3,610 |
| 2017 | $215 | $4,810 | $1,200 | $3,610 |
| 2016 | $215 | $4,810 | $1,200 | $3,610 |
| 2015 | $284 | $6,320 | $1,600 | $4,720 |
| 2014 | $284 | $6,320 | $1,600 | $4,720 |
Source: Public Records
Map
Nearby Homes