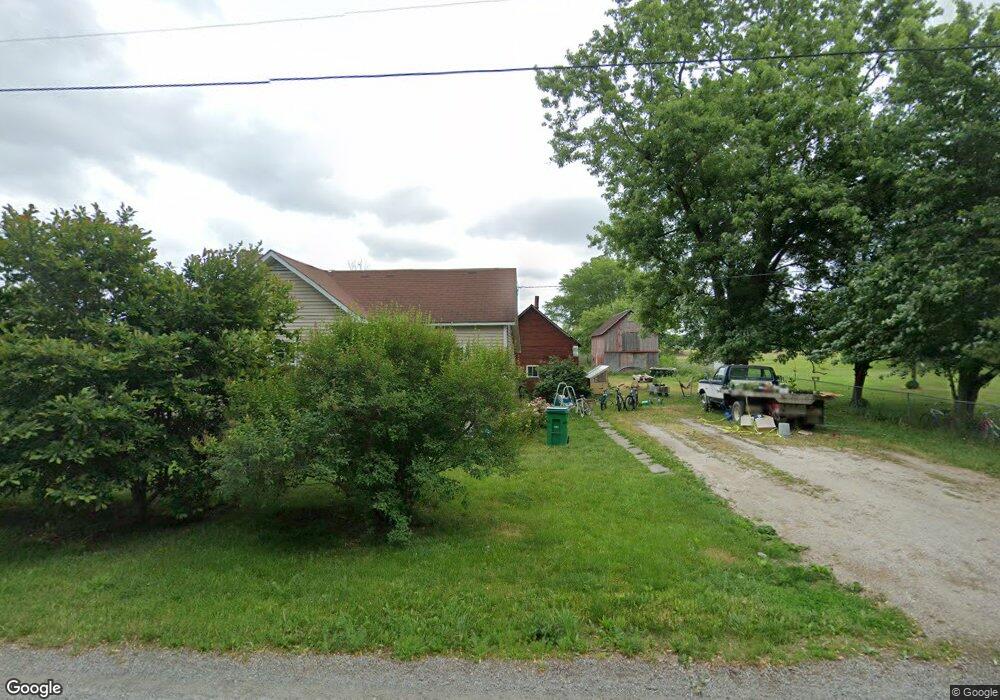
736 N Queen Rd Walkerton, IN 46574
Estimated Value: $97,000 - $186,000
3
Beds
1
Bath
970
Sq Ft
$140/Sq Ft
Est. Value
About This Home
This home is located at 736 N Queen Rd, Walkerton, IN 46574 and is currently estimated at $135,702, approximately $139 per square foot. 736 N Queen Rd is a home located in Marshall County with nearby schools including John Glenn High School.
Ownership History
Date
Name
Owned For
Owner Type
Purchase Details
Closed on
Feb 10, 2011
Sold by
Smiddy James R
Bought by
Smiddy Valarie I
Current Estimated Value
Purchase Details
Closed on
Dec 4, 2009
Sold by
Federal Home Loan Mortgage Corporation
Bought by
Smiddy James R
Purchase Details
Closed on
Nov 23, 2009
Sold by
Federal Home Loan Mortgage Corporation
Bought by
Smiddy James R
Purchase Details
Closed on
Sep 22, 2009
Sold by
Vanvactor Sheriff Jon E
Bought by
Federal Home Loan Mortgage Corp
Purchase Details
Closed on
May 14, 1999
Sold by
Kruyer Margaret L
Bought by
Hummel Ernest D
Create a Home Valuation Report for This Property
The Home Valuation Report is an in-depth analysis detailing your home's value as well as a comparison with similar homes in the area
Home Values in the Area
Average Home Value in this Area
Purchase History
| Date | Buyer | Sale Price | Title Company |
|---|---|---|---|
| Smiddy Valarie I | -- | None Available | |
| Smiddy James R | -- | None Available | |
| Smiddy James R | $19,900 | Statewide Title Co | |
| Federal Home Loan Mortgage Corp | -- | Feiwell & Hannoy | |
| Federal Home Loan Mortgage Corporation | $49,419 | None Available | |
| Hummel Ernest D | $44,000 | -- |
Source: Public Records
Tax History Compared to Growth
Tax History
| Year | Tax Paid | Tax Assessment Tax Assessment Total Assessment is a certain percentage of the fair market value that is determined by local assessors to be the total taxable value of land and additions on the property. | Land | Improvement |
|---|---|---|---|---|
| 2024 | $280 | $81,000 | $12,400 | $68,600 |
| 2022 | $280 | $59,500 | $9,900 | $49,600 |
| 2021 | $184 | $48,700 | $9,900 | $38,800 |
| 2020 | $190 | $51,100 | $10,400 | $40,700 |
| 2019 | $180 | $47,200 | $10,000 | $37,200 |
| 2018 | $187 | $46,700 | $9,900 | $36,800 |
| 2017 | $181 | $46,100 | $9,900 | $36,200 |
| 2016 | $168 | $46,100 | $9,900 | $36,200 |
| 2014 | $165 | $49,100 | $10,700 | $38,400 |
Source: Public Records
Map
Nearby Homes