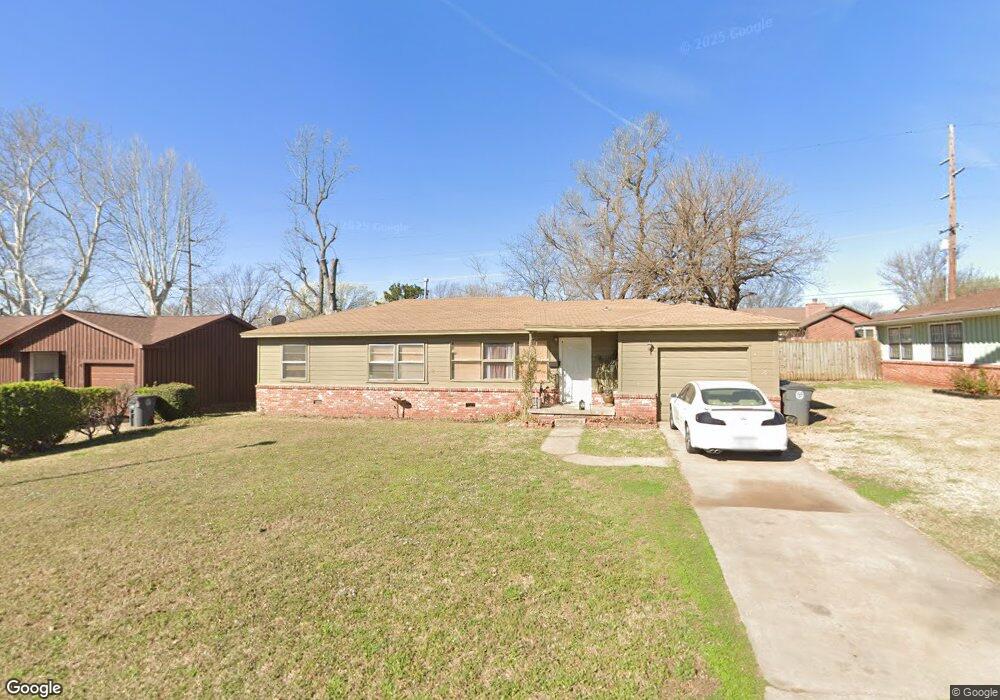
736 N Xenophon Ave Tulsa, OK 74127
Gilcrease Hills NeighborhoodEstimated Value: $120,000 - $220,000
3
Beds
2
Baths
1,804
Sq Ft
$102/Sq Ft
Est. Value
About This Home
This home is located at 736 N Xenophon Ave, Tulsa, OK 74127 and is currently estimated at $184,000, approximately $101 per square foot. 736 N Xenophon Ave is a home located in Osage County with nearby schools including Greenwood Leadership Academy, Central Middle School, and Central Junior High School.
Ownership History
Date
Name
Owned For
Owner Type
Purchase Details
Closed on
Sep 13, 2007
Sold by
Equity Trust Co
Bought by
Jones Jay
Current Estimated Value
Create a Home Valuation Report for This Property
The Home Valuation Report is an in-depth analysis detailing your home's value as well as a comparison with similar homes in the area
Home Values in the Area
Average Home Value in this Area
Purchase History
| Date | Buyer | Sale Price | Title Company |
|---|---|---|---|
| Jones Jay | $32,000 | -- |
Source: Public Records
Tax History Compared to Growth
Tax History
| Year | Tax Paid | Tax Assessment Tax Assessment Total Assessment is a certain percentage of the fair market value that is determined by local assessors to be the total taxable value of land and additions on the property. | Land | Improvement |
|---|---|---|---|---|
| 2025 | $1,338 | $11,133 | $567 | $10,566 |
| 2024 | $1,226 | $10,603 | $540 | $10,063 |
| 2023 | $1,226 | $10,098 | $540 | $9,558 |
| 2022 | $1,140 | $9,617 | $540 | $9,077 |
| 2021 | $1,127 | $9,617 | $540 | $9,077 |
| 2020 | $1,109 | $9,617 | $540 | $9,077 |
| 2019 | $1,180 | $9,617 | $540 | $9,077 |
| 2018 | $1,182 | $9,617 | $540 | $9,077 |
| 2017 | $1,185 | $9,617 | $540 | $9,077 |
| 2016 | $1,230 | $10,221 | $540 | $9,681 |
| 2015 | $1,162 | $9,734 | $540 | $9,194 |
| 2014 | $1,057 | $9,271 | $540 | $8,731 |
| 2013 | $1,007 | $8,829 | $540 | $8,289 |
Source: Public Records
Map
Nearby Homes
- 644 N Xenophon Ave
- 704 N Zenith Ave
- 582 N Xenophon Ave
- 1736 W Latimer Place
- 549 N 23rd West Ave
- 2320 W Easton Ct
- 2015 W Easton St
- 1805 W Easton St
- 2016 W Easton St
- 254 N Yukon Ave
- 1815 W Cameron St
- 2821 W Golden St
- 328 N Santa fe Ave
- 1717 W Newton St
- 1342 N Waco Ave
- 1315 W Easton St
- 1224 N Rosedale Ave
- 0 N Quanah Ave
- 1307 N Tacoma Ave Unit A
- 1307 N Tacoma Ave Unit B
- 730 N Xenophon Ave
- 746 N Xenophon Ave
- 737 N Yukon Ave
- 726 N Xenophon Ave
- 731 N Yukon Ave
- 743 N Yukon Ave
- 1925 W Haskell Place
- 727 N Yukon Ave
- 749 N Yukon Ave
- 1918 W Haskell Place
- 722 N Xenophon Ave
- 1919 W Haskell Place
- 756 N Xenophon Ave
- 757 N Xenophon Ave
- 755 N Yukon Ave
- 721 N Yukon Ave
- 721 N Xenophon Ave
- 1914 W Haskell Place
- 716 N Xenophon Ave
- 738 N Yukon Ave