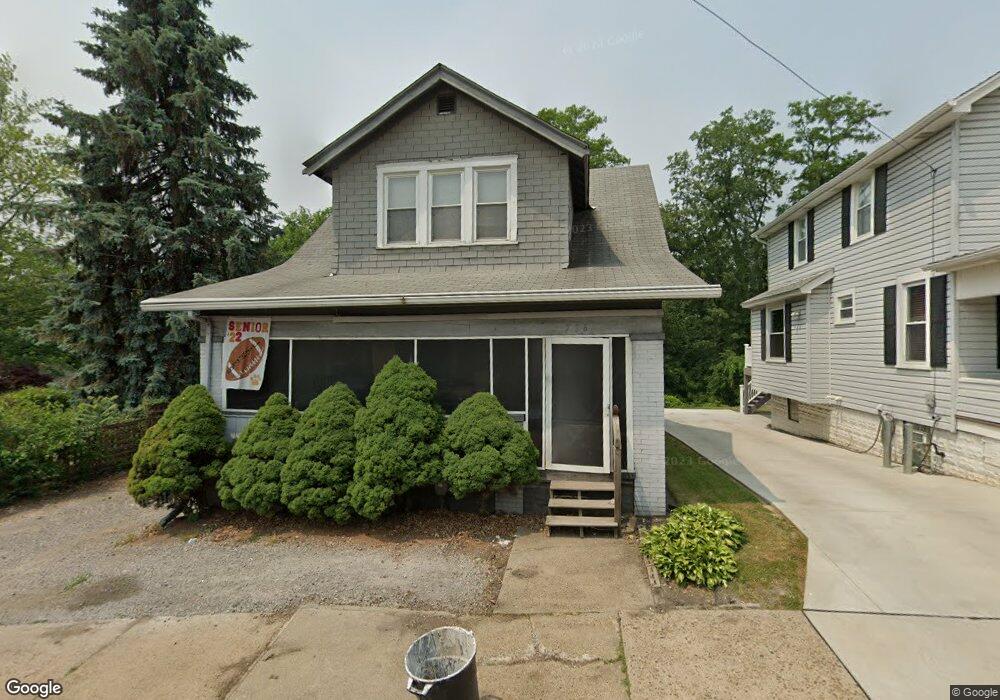
736 Penn Ave New Brighton, PA 15066
Estimated Value: $112,725 - $156,000
3
Beds
2
Baths
1,318
Sq Ft
$99/Sq Ft
Est. Value
About This Home
This home is located at 736 Penn Ave, New Brighton, PA 15066 and is currently estimated at $130,931, approximately $99 per square foot. 736 Penn Ave is a home located in Beaver County with nearby schools including New Brighton Elementary School, New Brighton Area Middle School, and New Brighton Area High School.
Ownership History
Date
Name
Owned For
Owner Type
Purchase Details
Closed on
Jun 11, 2010
Sold by
Bair Juston David and Bair Jennifer Jo
Bought by
Hough Ronald J and Hough Elizabeth A
Current Estimated Value
Home Financials for this Owner
Home Financials are based on the most recent Mortgage that was taken out on this home.
Original Mortgage
$72,030
Outstanding Balance
$47,751
Interest Rate
4.75%
Mortgage Type
FHA
Estimated Equity
$83,180
Purchase Details
Closed on
Nov 18, 2008
Sold by
Boyd Mark R and Boyd Danyelle N
Bought by
Bair Juston David
Home Financials for this Owner
Home Financials are based on the most recent Mortgage that was taken out on this home.
Original Mortgage
$62,311
Interest Rate
4.93%
Mortgage Type
VA
Purchase Details
Closed on
Nov 7, 2003
Sold by
Slima Carolyn
Bought by
Boyd Mark R
Home Financials for this Owner
Home Financials are based on the most recent Mortgage that was taken out on this home.
Original Mortgage
$33,725
Interest Rate
6.01%
Mortgage Type
New Conventional
Create a Home Valuation Report for This Property
The Home Valuation Report is an in-depth analysis detailing your home's value as well as a comparison with similar homes in the area
Home Values in the Area
Average Home Value in this Area
Purchase History
| Date | Buyer | Sale Price | Title Company |
|---|---|---|---|
| Hough Ronald J | $73,000 | None Available | |
| Bair Juston David | $61,000 | None Available | |
| Boyd Mark R | $35,500 | -- |
Source: Public Records
Mortgage History
| Date | Status | Borrower | Loan Amount |
|---|---|---|---|
| Open | Hough Ronald J | $72,030 | |
| Previous Owner | Bair Juston David | $62,311 | |
| Previous Owner | Boyd Mark R | $33,725 |
Source: Public Records
Tax History Compared to Growth
Tax History
| Year | Tax Paid | Tax Assessment Tax Assessment Total Assessment is a certain percentage of the fair market value that is determined by local assessors to be the total taxable value of land and additions on the property. | Land | Improvement |
|---|---|---|---|---|
| 2025 | $600 | $45,250 | $10,350 | $34,900 |
| 2024 | $1,849 | $45,250 | $10,350 | $34,900 |
| 2023 | $1,904 | $15,000 | $2,550 | $12,450 |
| 2022 | $1,882 | $15,000 | $2,550 | $12,450 |
| 2021 | $1,882 | $15,000 | $2,550 | $12,450 |
| 2020 | $1,832 | $15,000 | $2,550 | $12,450 |
| 2019 | $1,802 | $15,000 | $2,550 | $12,450 |
| 2018 | $1,732 | $15,000 | $2,550 | $12,450 |
| 2017 | $1,732 | $15,000 | $2,550 | $12,450 |
| 2016 | $1,643 | $15,000 | $2,550 | $12,450 |
| 2015 | $333 | $15,000 | $2,550 | $12,450 |
| 2014 | $333 | $15,000 | $2,550 | $12,450 |
Source: Public Records
Map
Nearby Homes