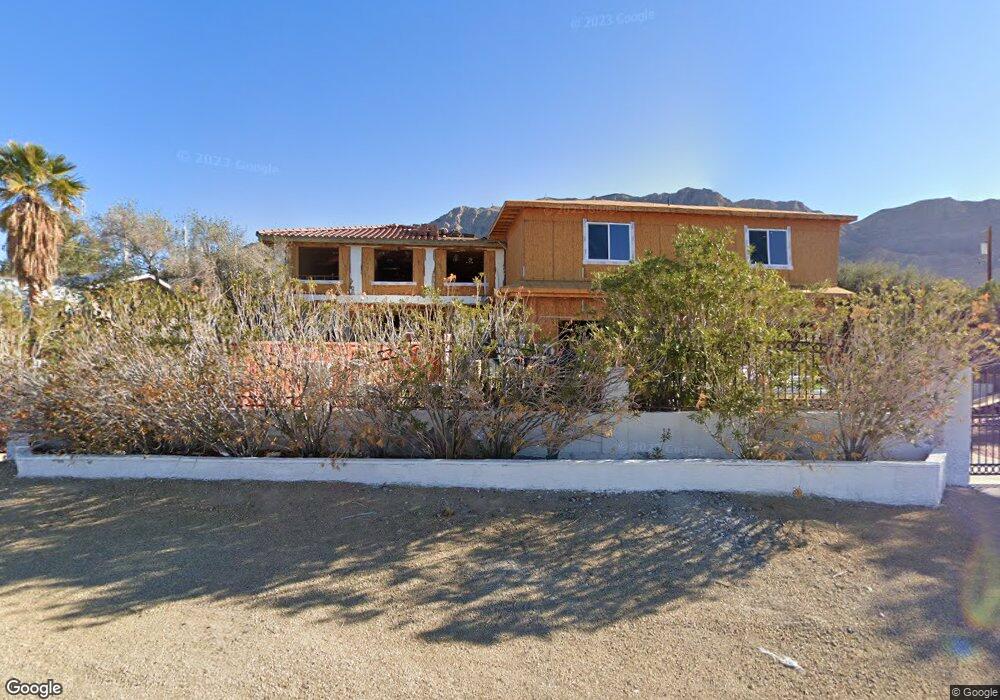
736 Radwick Dr Las Vegas, NV 89110
Estimated Value: $653,000 - $807,078
4
Beds
4
Baths
4,079
Sq Ft
$184/Sq Ft
Est. Value
About This Home
This home is located at 736 Radwick Dr, Las Vegas, NV 89110 and is currently estimated at $748,520, approximately $183 per square foot. 736 Radwick Dr is a home located in Clark County with nearby schools including Mervin Iverson Elementary School, Kathleen & Tim Harney Middle School, and Las Vegas High School.
Ownership History
Date
Name
Owned For
Owner Type
Purchase Details
Closed on
Jun 12, 2025
Sold by
County Treasurer
Bought by
Castillo Ricardo A
Current Estimated Value
Purchase Details
Closed on
Oct 13, 2020
Sold by
Vegas Redevelopment Group Llc
Bought by
Castillo Ricardo A
Home Financials for this Owner
Home Financials are based on the most recent Mortgage that was taken out on this home.
Original Mortgage
$500,000
Interest Rate
2.9%
Mortgage Type
Commercial
Purchase Details
Closed on
Feb 14, 2020
Sold by
Bourgault Richard T and Bourgault Kathryn M
Bought by
Vegas Redevelopement Group Llc
Home Financials for this Owner
Home Financials are based on the most recent Mortgage that was taken out on this home.
Original Mortgage
$375,000
Interest Rate
3.72%
Mortgage Type
Seller Take Back
Create a Home Valuation Report for This Property
The Home Valuation Report is an in-depth analysis detailing your home's value as well as a comparison with similar homes in the area
Home Values in the Area
Average Home Value in this Area
Purchase History
| Date | Buyer | Sale Price | Title Company |
|---|---|---|---|
| Castillo Ricardo A | $15,772 | None Listed On Document | |
| Castillo Ricardo A | $375,000 | Wfg National Title Compan | |
| Vegas Redevelopement Group Llc | $350,000 | Wfg National Title Compan |
Source: Public Records
Mortgage History
| Date | Status | Borrower | Loan Amount |
|---|---|---|---|
| Previous Owner | Castillo Ricardo A | $500,000 | |
| Previous Owner | Vegas Redevelopement Group Llc | $375,000 |
Source: Public Records
Tax History Compared to Growth
Tax History
| Year | Tax Paid | Tax Assessment Tax Assessment Total Assessment is a certain percentage of the fair market value that is determined by local assessors to be the total taxable value of land and additions on the property. | Land | Improvement |
|---|---|---|---|---|
| 2025 | $4,177 | $142,319 | $43,750 | $98,569 |
| 2024 | $3,633 | $142,319 | $43,750 | $98,569 |
| 2023 | $3,633 | $144,461 | $49,000 | $95,461 |
| 2022 | $3,364 | $130,825 | $42,000 | $88,825 |
| 2021 | $3,115 | $120,672 | $35,000 | $85,672 |
| 2020 | $2,889 | $121,133 | $35,000 | $86,133 |
| 2019 | $2,708 | $115,749 | $29,750 | $85,999 |
| 2018 | $2,629 | $111,627 | $28,000 | $83,627 |
| 2017 | $3,347 | $114,114 | $28,000 | $86,114 |
| 2016 | $2,490 | $106,642 | $19,250 | $87,392 |
| 2015 | $2,485 | $100,870 | $14,000 | $86,870 |
| 2014 | $2,412 | $82,464 | $12,250 | $70,214 |
Source: Public Records
Map
Nearby Homes
- 738 Rossmore Dr
- 853 Morning Sun Ct
- 706 N Hollywood Blvd
- 650 N Hollywood Blvd
- 485 Sari Dr
- 6688 Martinsville Place
- 807 Sun Shimmer Place
- 437 Rossmore Dr
- 6561 Alma White St
- 1086 Eastridge Way
- 1030 Pearl Peak St
- 956 Sugar Springs Dr
- 6538 Astorville Ct
- 0 Linden Ave
- 440 Probst
- 255 Vista Valley St
- 0 Vista Valley St
- 1083 Sterling Peak St
- 1166 Panorama Heights St
- 0 Peaceful St
- 758 Radwick Dr
- 727 Radwick Dr
- 6907 Stone Dr
- 745 Radwick Dr
- 6885 E Bonanza Rd
- 6869 E Bonanza Rd
- 701 Radwick Dr
- 6901 E Bonanza Rd
- 755 Sari Dr
- 733 Sari Dr
- 6917 E Bonanza Rd
- 714 Rossmore Dr
- 686 Radwick Dr
- 679 Radwick Dr
- 787 Radwick Dr
- 764 Rossmore Dr
- 6933 E Bonanza Rd
- 665 Radwick Dr
- 477 Radwick Dr
- 468 Radwick Dr