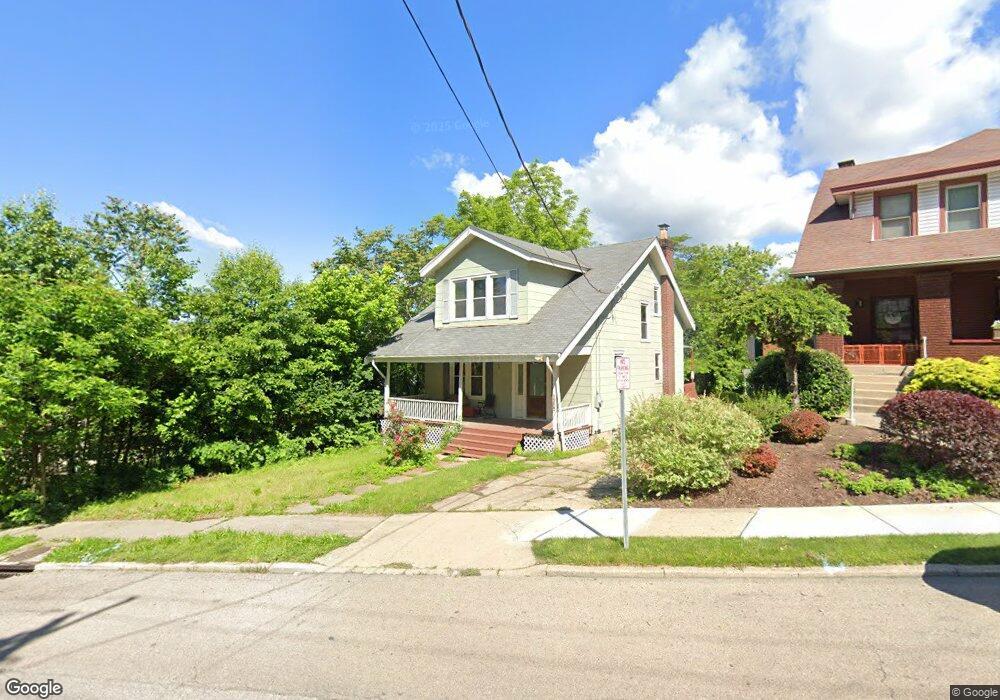
736 Riddle Rd Cincinnati, OH 45220
Clifton NeighborhoodEstimated Value: $152,000 - $208,000
3
Beds
1
Bath
1,429
Sq Ft
$132/Sq Ft
Est. Value
About This Home
This home is located at 736 Riddle Rd, Cincinnati, OH 45220 and is currently estimated at $188,356, approximately $131 per square foot. 736 Riddle Rd is a home located in Hamilton County with nearby schools including Clifton Area Neighborhood School, Robert A. Taft Information Technology High School, and Gilbert A. Dater High School.
Ownership History
Date
Name
Owned For
Owner Type
Purchase Details
Closed on
Jun 27, 2013
Sold by
Brant Stacey A
Bought by
Brant Meredith Joy
Current Estimated Value
Purchase Details
Closed on
Sep 22, 2010
Sold by
Dunn Robin L
Bought by
Muntifering Michael B
Home Financials for this Owner
Home Financials are based on the most recent Mortgage that was taken out on this home.
Original Mortgage
$61,290
Outstanding Balance
$39,854
Interest Rate
4.45%
Mortgage Type
VA
Estimated Equity
$148,502
Purchase Details
Closed on
Dec 23, 2008
Sold by
Dunn Jeff A
Bought by
Dunn Robin L
Purchase Details
Closed on
May 17, 2000
Sold by
Kummer Donna C
Bought by
Dunn Jeff A and Dunn Robin L
Home Financials for this Owner
Home Financials are based on the most recent Mortgage that was taken out on this home.
Original Mortgage
$63,736
Interest Rate
8.21%
Create a Home Valuation Report for This Property
The Home Valuation Report is an in-depth analysis detailing your home's value as well as a comparison with similar homes in the area
Home Values in the Area
Average Home Value in this Area
Purchase History
| Date | Buyer | Sale Price | Title Company |
|---|---|---|---|
| Brant Meredith Joy | -- | None Available | |
| Muntifering Michael B | $60,000 | Attorney | |
| Dunn Robin L | -- | None Available | |
| Dunn Jeff A | $63,800 | -- |
Source: Public Records
Mortgage History
| Date | Status | Borrower | Loan Amount |
|---|---|---|---|
| Open | Muntifering Michael B | $61,290 | |
| Previous Owner | Dunn Jeff A | $63,736 |
Source: Public Records
Tax History
| Year | Tax Paid | Tax Assessment Tax Assessment Total Assessment is a certain percentage of the fair market value that is determined by local assessors to be the total taxable value of land and additions on the property. | Land | Improvement |
|---|---|---|---|---|
| 2025 | $2,899 | $46,921 | $16,100 | $30,821 |
| 2024 | $2,814 | $46,921 | $16,100 | $30,821 |
| 2023 | $2,875 | $46,921 | $16,100 | $30,821 |
| 2022 | $2,023 | $29,579 | $9,177 | $20,402 |
| 2021 | $1,945 | $29,579 | $9,177 | $20,402 |
| 2020 | $2,001 | $29,579 | $9,177 | $20,402 |
| 2019 | $1,920 | $25,946 | $8,050 | $17,896 |
| 2018 | $1,923 | $25,946 | $8,050 | $17,896 |
| 2017 | $1,827 | $25,946 | $8,050 | $17,896 |
| 2016 | $1,702 | $23,311 | $8,124 | $15,187 |
| 2015 | $1,504 | $23,311 | $8,124 | $15,187 |
| 2014 | $1,515 | $23,311 | $8,124 | $15,187 |
| 2013 | $1,389 | $21,001 | $7,319 | $13,682 |
Source: Public Records
Map
Nearby Homes
- 2992 W McMicken Ave
- 2963 Deckebach Ave
- 607 Foulke St
- 610 Riddle Rd
- 2863 Marshall Ave
- 517 Riddle Rd
- 520 Probasco St
- 3091 Riddle View Ln
- 3011 Riddle View Ln
- 1050 Marshall Ave
- 3027 Colerain Ave
- 396 Probasco St
- 3315 Morrison Ave
- 3321 Morrison Ave
- 507 Tafel St
- 521 Tafel St
- 567 Howell Ave
- 760 Straight St
- 501 Terrace Ave
- 3119 Colerain Ave
- 734 Riddle Rd
- 2968 W McMicken Ave
- 2970 W McMicken Ave
- 2972 W McMicken Ave
- 738 Riddle Rd
- 2976 W McMicken Ave
- 2966 W McMicken Ave
- 2980 W McMicken Ave
- 723 Riddle Rd
- 727 Riddle Rd
- 718 Riddle Rd
- 2984 W McMicken Ave
- 731 Riddle Rd
- 735 Riddle Rd
- 735 Riddler Rd
- 2962 W McMicken Ave
- 2988 W McMicken Ave
- 707 Riddle Rd
- 2960 W McMicken Ave
- 700 Riddle Rd
Your Personal Tour Guide
Ask me questions while you tour the home.