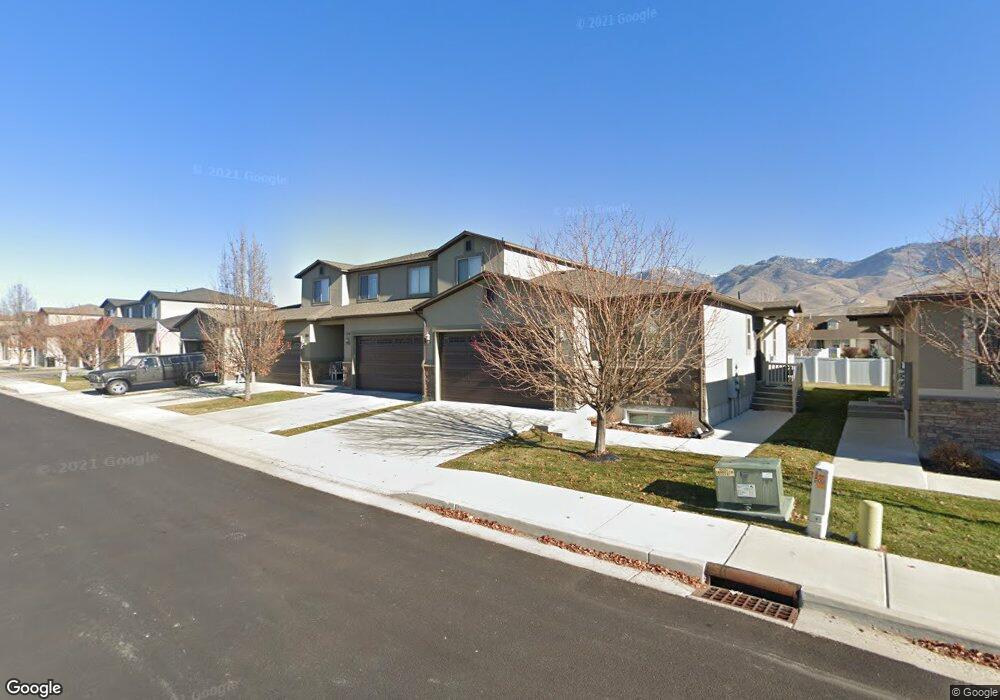
736 S 150 E Smithfield, UT 84335
Estimated Value: $362,000 - $460,000
4
Beds
4
Baths
2,352
Sq Ft
$170/Sq Ft
Est. Value
About This Home
This home is located at 736 S 150 E, Smithfield, UT 84335 and is currently estimated at $400,993, approximately $170 per square foot. 736 S 150 E is a home located in Cache County with nearby schools including Summit School, Cedar Ridge School, and North Cache Middle School.
Ownership History
Date
Name
Owned For
Owner Type
Purchase Details
Closed on
Jul 5, 2016
Sold by
Cox Robert and Cox Lisa
Bought by
Hebert Leonard W and Rogers Elizabeth
Current Estimated Value
Home Financials for this Owner
Home Financials are based on the most recent Mortgage that was taken out on this home.
Original Mortgage
$126,912
Outstanding Balance
$100,965
Interest Rate
3.64%
Mortgage Type
New Conventional
Estimated Equity
$300,028
Purchase Details
Closed on
Apr 6, 2015
Sold by
James Bonnie L
Bought by
Cox Robert and Cox Lisa
Purchase Details
Closed on
Nov 20, 2013
Sold by
James Bonnie L
Bought by
James Bonnie L
Purchase Details
Closed on
Sep 26, 2013
Sold by
North Ridge Development Llc
Bought by
James Bonnie L
Create a Home Valuation Report for This Property
The Home Valuation Report is an in-depth analysis detailing your home's value as well as a comparison with similar homes in the area
Home Values in the Area
Average Home Value in this Area
Purchase History
| Date | Buyer | Sale Price | Title Company |
|---|---|---|---|
| Hebert Leonard W | -- | Hickman Land Title Company | |
| Cox Robert | -- | Cache Title | |
| James Bonnie L | -- | Hickman Land Title Company | |
| James Bonnie L | -- | Hickman Land Title Company |
Source: Public Records
Mortgage History
| Date | Status | Borrower | Loan Amount |
|---|---|---|---|
| Open | Hebert Leonard W | $126,912 |
Source: Public Records
Tax History
| Year | Tax Paid | Tax Assessment Tax Assessment Total Assessment is a certain percentage of the fair market value that is determined by local assessors to be the total taxable value of land and additions on the property. | Land | Improvement |
|---|---|---|---|---|
| 2025 | $1,601 | $214,390 | $0 | $0 |
| 2024 | $1,723 | $216,320 | $0 | $0 |
| 2023 | $1,760 | $209,055 | $0 | $0 |
| 2022 | $1,789 | $209,055 | $0 | $0 |
| 2021 | $16 | $290,448 | $60,000 | $230,448 |
| 2020 | $1,564 | $260,390 | $60,000 | $200,390 |
| 2019 | $1,420 | $225,390 | $25,000 | $200,390 |
| 2018 | $1,328 | $203,920 | $25,000 | $178,920 |
| 2017 | $1,281 | $107,470 | $0 | $0 |
| 2016 | $1,304 | $91,135 | $0 | $0 |
| 2015 | $1,110 | $91,135 | $0 | $0 |
| 2014 | $1,089 | $91,135 | $0 | $0 |
| 2013 | -- | $25,000 | $0 | $0 |
Source: Public Records
Map
Nearby Homes
Your Personal Tour Guide
Ask me questions while you tour the home.