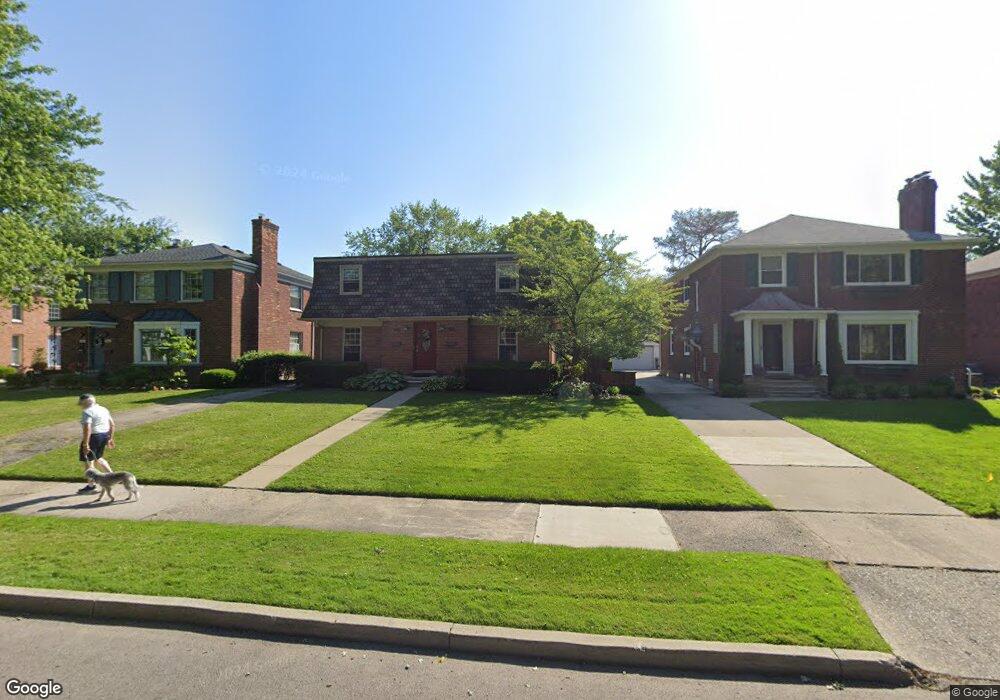
736 Trombley Rd Unit 38 Grosse Pointe Park, MI 48230
Estimated Value: $343,782 - $422,000
--
Bed
2
Baths
2,125
Sq Ft
$180/Sq Ft
Est. Value
About This Home
This home is located at 736 Trombley Rd Unit 38, Grosse Pointe Park, MI 48230 and is currently estimated at $382,696, approximately $180 per square foot. 736 Trombley Rd Unit 38 is a home located in Wayne County with nearby schools including Pierce Middle School, Grosse Pointe South High School, and Detroit Merit Charter Academy.
Ownership History
Date
Name
Owned For
Owner Type
Purchase Details
Closed on
Jul 11, 2019
Sold by
Valente Claudia B and Valente Mark
Bought by
Valente James B
Current Estimated Value
Purchase Details
Closed on
Dec 21, 2007
Sold by
Valente Mark and Valente Claudia B
Bought by
Valente Mark
Purchase Details
Closed on
Dec 17, 2007
Sold by
Baker Judith F and Whinnery Frances
Bought by
Valente Mark
Purchase Details
Closed on
Jul 20, 2004
Sold by
Whinnery Frances and Holmes Daniel
Bought by
Baker Judith F
Purchase Details
Closed on
Sep 15, 2003
Sold by
Baker Judith F
Bought by
Whinnery Frances
Create a Home Valuation Report for This Property
The Home Valuation Report is an in-depth analysis detailing your home's value as well as a comparison with similar homes in the area
Home Values in the Area
Average Home Value in this Area
Purchase History
| Date | Buyer | Sale Price | Title Company |
|---|---|---|---|
| Valente James B | $95,000 | None Available | |
| Valente Mark | -- | None Available | |
| Valente Mark | $160,000 | Lawyers Title | |
| Baker Judith F | -- | Chirco Title Company | |
| Whinnery Frances | -- | Chirco Title Company |
Source: Public Records
Tax History Compared to Growth
Tax History
| Year | Tax Paid | Tax Assessment Tax Assessment Total Assessment is a certain percentage of the fair market value that is determined by local assessors to be the total taxable value of land and additions on the property. | Land | Improvement |
|---|---|---|---|---|
| 2025 | $2,840 | $136,100 | $0 | $0 |
| 2024 | $2,840 | $128,300 | $0 | $0 |
| 2023 | $2,712 | $122,600 | $0 | $0 |
| 2022 | $2,577 | $116,400 | $0 | $0 |
| 2021 | $6,611 | $115,600 | $0 | $0 |
| 2019 | $5,488 | $97,800 | $0 | $0 |
| 2018 | $2,088 | $91,600 | $0 | $0 |
| 2017 | $6,922 | $51,500 | $0 | $0 |
| 2016 | $5,451 | $91,400 | $0 | $0 |
| 2015 | $7,814 | $87,300 | $0 | $0 |
| 2013 | -- | $76,700 | $0 | $0 |
| 2012 | $2,120 | $80,200 | $39,900 | $40,300 |
Source: Public Records
Map
Nearby Homes
- 718 Berkshire Rd
- 814 Harcourt Rd Unit 816
- 875 Balfour St
- 801 Park Ln
- 709 Middlesex Rd
- 709 Lakepointe St
- 784 Barrington Rd
- 614 Pemberton Rd
- 976 Lakepointe St
- 15345 Windmill Pointe Dr
- 504 Alter Rd
- 847 Barrington Rd
- 74 Pointe Park Place Unit 311
- 54 Pointe Park Place Unit 208
- 1032 Beaconsfield Ave
- 15215 Windmill Pointe Dr
- 709 Ashland St
- 15230 Windmill Pointe Dr
- 1058 Lakepointe St
- 1048 Lakepointe St Unit A
- 740 Trombley Rd
- 732 Trombley Rd Unit 34
- 732 Trombley Rd Unit 734
- 728 Trombley Rd
- 744 Trombley Rd
- 746 Trombley Rd
- 752 Trombley Rd # 54
- 735 Harcourt Rd
- 735 Harcourt Rd Unit 737
- 724 Trombley Rd Unit 726
- 739 Harcourt Rd Unit 41
- 743 Harcourt Rd Unit Lower Flat
- 743 Harcourt Rd
- 743 Harcourt Rd Unit Lower
- 731 Harcourt Rd Unit 33
- 731 Harcourt Rd Unit 733
- 727 Harcourt Rd
- 752 Trombley Rd
- 752 Trombley Rd
- 752 Trombley Rd