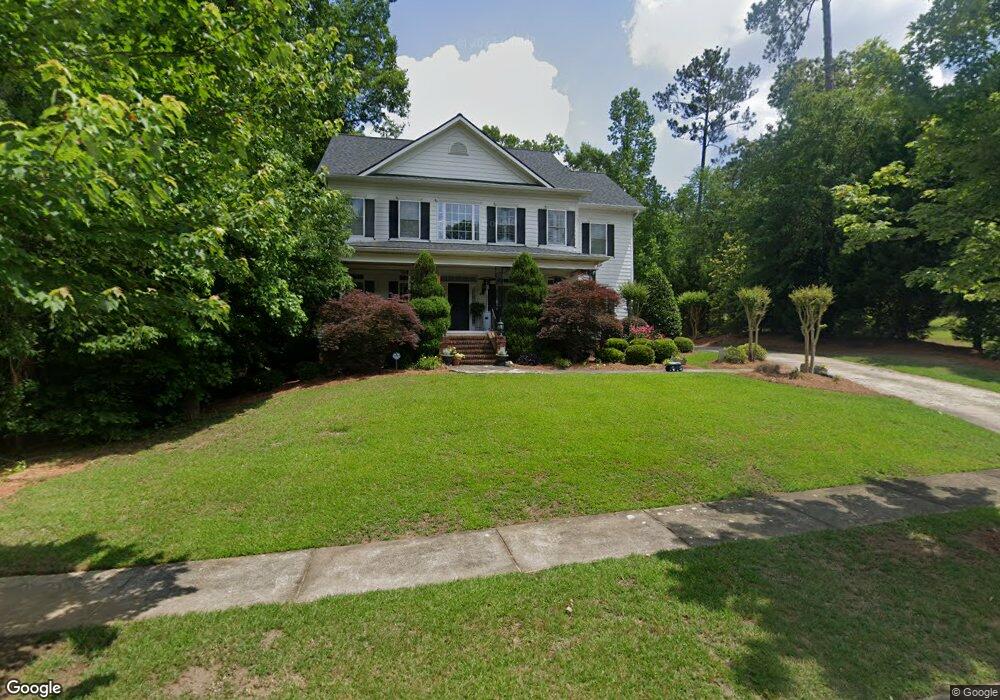
736 Waverly Point Macon, GA 31210
Estimated Value: $604,000 - $645,000
5
Beds
5
Baths
4,141
Sq Ft
$150/Sq Ft
Est. Value
About This Home
This home is located at 736 Waverly Point, Macon, GA 31210 and is currently estimated at $619,940, approximately $149 per square foot. 736 Waverly Point is a home located in Bibb County with nearby schools including Springdale Elementary School, Howard Middle School, and Howard High School.
Ownership History
Date
Name
Owned For
Owner Type
Purchase Details
Closed on
Feb 11, 2011
Sold by
National Residential Nominee Services In
Bought by
Erickson Erick W and Erickson Christy A
Current Estimated Value
Home Financials for this Owner
Home Financials are based on the most recent Mortgage that was taken out on this home.
Original Mortgage
$299,920
Outstanding Balance
$203,299
Interest Rate
4.66%
Mortgage Type
New Conventional
Estimated Equity
$416,641
Purchase Details
Closed on
May 24, 2010
Sold by
Coffman Rudy C and Coffman Deborah A
Bought by
National Residential Nominee Services In
Purchase Details
Closed on
Nov 13, 2003
Home Financials for this Owner
Home Financials are based on the most recent Mortgage that was taken out on this home.
Original Mortgage
$289,520
Interest Rate
6.04%
Mortgage Type
Future Advance Clause Open End Mortgage
Create a Home Valuation Report for This Property
The Home Valuation Report is an in-depth analysis detailing your home's value as well as a comparison with similar homes in the area
Purchase History
| Date | Buyer | Sale Price | Title Company |
|---|---|---|---|
| Erickson Erick W | $374,900 | None Available | |
| National Residential Nominee Services In | $422,500 | None Available | |
| -- | $62,000 | -- |
Source: Public Records
Mortgage History
| Date | Status | Borrower | Loan Amount |
|---|---|---|---|
| Open | Erickson Erick W | $299,920 | |
| Previous Owner | -- | $289,520 |
Source: Public Records
Tax History
| Year | Tax Paid | Tax Assessment Tax Assessment Total Assessment is a certain percentage of the fair market value that is determined by local assessors to be the total taxable value of land and additions on the property. | Land | Improvement |
|---|---|---|---|---|
| 2025 | $5,236 | $220,068 | $23,000 | $197,068 |
| 2024 | $5,411 | $220,068 | $23,000 | $197,068 |
| 2023 | $4,418 | $198,953 | $23,000 | $175,953 |
| 2022 | $5,837 | $175,611 | $26,400 | $149,211 |
| 2021 | $6,195 | $170,024 | $26,400 | $143,624 |
| 2020 | $6,036 | $162,465 | $26,400 | $136,065 |
| 2019 | $6,086 | $162,465 | $26,400 | $136,065 |
| 2018 | $9,500 | $162,465 | $26,400 | $136,065 |
| 2017 | $5,825 | $162,465 | $26,400 | $136,065 |
| 2016 | $5,379 | $162,465 | $26,400 | $136,065 |
| 2015 | $7,614 | $162,465 | $26,400 | $136,065 |
| 2014 | $8,402 | $178,302 | $33,000 | $145,302 |
Source: Public Records
Map
Nearby Homes
- 730 Waverly Point
- 726 Waverly Point
- 605 Waverly Ct
- 609 Waverly Ct
- 135 Providence Blvd
- 916 Huntcliffe Dr
- 855 Tufthunter
- 326 Carillon Ln
- 859 Tufthunter
- 340 Providence Blvd
- 332 Providence Blvd
- 506 Whistler Ln N
- 101 Westchester Dr
- 4265 Sheraton Dr
- 0 Kentucky Downs Dr Unit 183774
- 0 Kentucky Downs Dr Unit 10721608
- 100 S Haven Ct
- 203 Westchester Dr
- 504 Edgefield Way
- 630 Millrun Ct
- 735 Waverly Pointe
- 731 Waverly Pointe
- 731 Waverly Point
- 739 Waverly Point
- 740 Waverly Point
- 430 Waverly Ln
- 727 Waverly Pointe
- 426 Waverly Ln
- 727 Waverly Point
- 422 Waverly Ln
- 723 Waverly Point
- 606 Waverly Ct
- 420 Waverly Ln
- 719 Waverly Point
- 719 Waverly Point
- 431 Waverly Ln
- 427 Waverly Ln
- 604 Waverly Ct
- 5765 Sweetbriar Trail
- 423 Waverly Ln
Your Personal Tour Guide
Ask me questions while you tour the home.