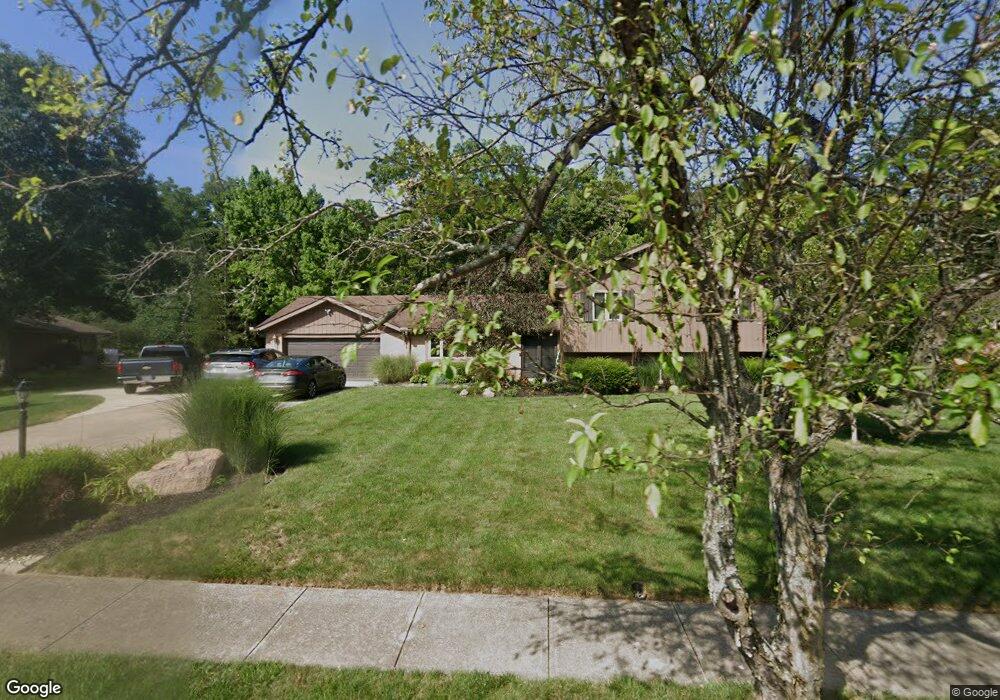
7360 Forest Brook Blvd Dayton, OH 45459
Estimated Value: $389,879 - $433,000
4
Beds
4
Baths
3,331
Sq Ft
$124/Sq Ft
Est. Value
About This Home
This home is located at 7360 Forest Brook Blvd, Dayton, OH 45459 and is currently estimated at $413,720, approximately $124 per square foot. 7360 Forest Brook Blvd is a home located in Montgomery County with nearby schools including Primary Village North, Stingley Elementary School, and Tower Heights Middle School.
Ownership History
Date
Name
Owned For
Owner Type
Purchase Details
Closed on
Apr 10, 2009
Sold by
Farrow Anthony W
Bought by
King William D and Nichols Julie M
Current Estimated Value
Home Financials for this Owner
Home Financials are based on the most recent Mortgage that was taken out on this home.
Original Mortgage
$182,132
Interest Rate
5.05%
Mortgage Type
FHA
Purchase Details
Closed on
May 9, 2007
Sold by
Farrow Anthony W and Farrow Cheryl B
Bought by
Farrow Anthony W
Home Financials for this Owner
Home Financials are based on the most recent Mortgage that was taken out on this home.
Original Mortgage
$165,500
Interest Rate
6.21%
Mortgage Type
Purchase Money Mortgage
Purchase Details
Closed on
Mar 2, 2007
Sold by
Meiring Daniel E and Meiring Patricia J
Bought by
Farrow Anthony W and Farrow Cheryl B
Home Financials for this Owner
Home Financials are based on the most recent Mortgage that was taken out on this home.
Original Mortgage
$115,500
Interest Rate
6.4%
Mortgage Type
Purchase Money Mortgage
Create a Home Valuation Report for This Property
The Home Valuation Report is an in-depth analysis detailing your home's value as well as a comparison with similar homes in the area
Purchase History
| Date | Buyer | Sale Price | Title Company |
|---|---|---|---|
| King William D | $199,000 | Attorney | |
| Farrow Anthony W | -- | Attorney | |
| Farrow Anthony W | $224,000 | Attorney |
Source: Public Records
Mortgage History
| Date | Status | Borrower | Loan Amount |
|---|---|---|---|
| Closed | King William D | $182,132 | |
| Closed | Farrow Anthony W | $165,500 | |
| Closed | Farrow Anthony W | $115,500 |
Source: Public Records
Tax History
| Year | Tax Paid | Tax Assessment Tax Assessment Total Assessment is a certain percentage of the fair market value that is determined by local assessors to be the total taxable value of land and additions on the property. | Land | Improvement |
|---|---|---|---|---|
| 2025 | $6,889 | $108,540 | $22,750 | $85,790 |
| 2024 | $6,299 | $108,540 | $22,750 | $85,790 |
| 2023 | $6,299 | $108,540 | $22,750 | $85,790 |
| 2022 | $6,109 | $83,490 | $17,500 | $65,990 |
| 2021 | $6,126 | $83,490 | $17,500 | $65,990 |
| 2020 | $5,976 | $81,550 | $17,500 | $64,050 |
| 2019 | $6,293 | $76,660 | $17,500 | $59,160 |
| 2018 | $5,577 | $76,660 | $17,500 | $59,160 |
| 2017 | $5,512 | $76,660 | $17,500 | $59,160 |
| 2016 | $5,751 | $75,500 | $17,500 | $58,000 |
| 2015 | $5,692 | $75,500 | $17,500 | $58,000 |
| 2014 | $5,692 | $75,500 | $17,500 | $58,000 |
| 2012 | -- | $70,000 | $17,500 | $52,500 |
Source: Public Records
Map
Nearby Homes
- 1366 Scenicview Ct
- 942 Fawn Lea Trail Unit 2525
- 7215 Whitetail Trail Unit 108108
- 6884 Cedar Cove Dr Unit 3380
- 6834 Cedar Cove Dr Unit 3175
- 1594 Mapleton Dr
- 1427 Weatherfield Ct Unit 1427
- 1160 Smugglers Way Unit 1433
- 1547 Ambridge Rd
- 7851 Millerton Dr
- 1440 Hollow Run Unit 1
- 7850 Raintree Rd
- 435 Blackstone Dr
- 1311 Hollow Run Unit 6
- 6640 Green Branch Dr Unit 7
- 6620 Green Branch Dr Unit 6
- 6644 Wareham Ct Unit 6644
- 6660 Wareham Ct Unit 7
- 6615 Hedington Square Unit 5
- 6673 Brigham Square
- 7310 Forest Brook Blvd
- 7380 Forest Brook Blvd
- 1356 Scenicview Ct
- 7410 Forest Brook Blvd
- 1111 Fox Chase Ct
- 1111 Fox Creek Ct
- 1121 Fox Chase Ct
- 7355 Forest Brook Blvd
- 7375 Forest Brook Blvd
- 7305 Forest Brook Blvd
- 1361 Scenicview Ct
- 7460 Forest Brook Blvd
- 7405 Forest Brook Blvd
- 7195 Wilderness Way
- 1360 Scenicview Ct
- 7275 Forest Brook Blvd
- 1131 Fox Chase Ct
- 7455 Forest Brook Blvd
- 1100 Fox Chase Ct
- 7480 Forest Brook Blvd
Your Personal Tour Guide
Ask me questions while you tour the home.