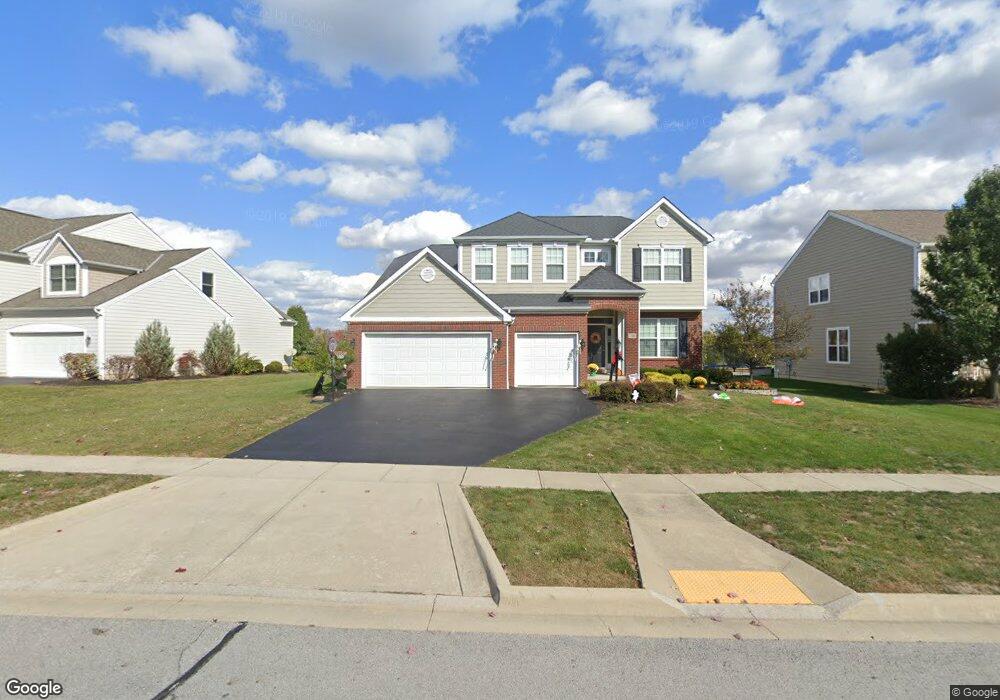
7360 Marrisey Loop Galena, OH 43021
Estimated Value: $516,000 - $655,000
4
Beds
3
Baths
3,164
Sq Ft
$189/Sq Ft
Est. Value
About This Home
This home is located at 7360 Marrisey Loop, Galena, OH 43021 and is currently estimated at $596,884, approximately $188 per square foot. 7360 Marrisey Loop is a home located in Delaware County with nearby schools including Big Walnut Elementary School, Big Walnut Intermediate School, and Big Walnut Middle School.
Ownership History
Date
Name
Owned For
Owner Type
Purchase Details
Closed on
Jun 7, 2024
Sold by
Machenheimer Andrew M and Machenheimer Dawn M
Bought by
Connor Shawn M and Connor Erica C
Current Estimated Value
Home Financials for this Owner
Home Financials are based on the most recent Mortgage that was taken out on this home.
Original Mortgage
$400,000
Outstanding Balance
$395,088
Interest Rate
7.22%
Mortgage Type
New Conventional
Estimated Equity
$201,796
Purchase Details
Closed on
Aug 7, 2014
Sold by
Foster Dawn M and Machenheimer Dawn M
Bought by
Machenheimer Andrew M and Machenheimer Dawn M
Purchase Details
Closed on
Mar 18, 2011
Sold by
Dominion Homes Inc
Bought by
Foster Dawn M
Home Financials for this Owner
Home Financials are based on the most recent Mortgage that was taken out on this home.
Original Mortgage
$257,968
Interest Rate
5.09%
Mortgage Type
New Conventional
Create a Home Valuation Report for This Property
The Home Valuation Report is an in-depth analysis detailing your home's value as well as a comparison with similar homes in the area
Home Values in the Area
Average Home Value in this Area
Purchase History
| Date | Buyer | Sale Price | Title Company |
|---|---|---|---|
| Connor Shawn M | $560,000 | Landsel Title | |
| Machenheimer Andrew M | -- | None Available | |
| Foster Dawn M | $338,000 | Alliance Title |
Source: Public Records
Mortgage History
| Date | Status | Borrower | Loan Amount |
|---|---|---|---|
| Open | Connor Shawn M | $400,000 | |
| Previous Owner | Foster Dawn M | $257,968 |
Source: Public Records
Tax History
| Year | Tax Paid | Tax Assessment Tax Assessment Total Assessment is a certain percentage of the fair market value that is determined by local assessors to be the total taxable value of land and additions on the property. | Land | Improvement |
|---|---|---|---|---|
| 2024 | $7,261 | $161,290 | $35,180 | $126,110 |
| 2023 | $7,156 | $161,290 | $35,180 | $126,110 |
| 2022 | $6,670 | $128,660 | $24,500 | $104,160 |
| 2021 | $6,700 | $128,660 | $24,500 | $104,160 |
| 2020 | $6,717 | $128,660 | $24,500 | $104,160 |
| 2019 | $6,635 | $121,840 | $24,500 | $97,340 |
| 2018 | $6,195 | $121,840 | $24,500 | $97,340 |
| 2017 | $5,679 | $115,050 | $22,090 | $92,960 |
| 2016 | $5,501 | $115,050 | $22,090 | $92,960 |
| 2015 | $5,529 | $115,050 | $22,090 | $92,960 |
| 2014 | $5,437 | $115,050 | $22,090 | $92,960 |
| 2013 | $5,628 | $112,360 | $22,090 | $90,270 |
Source: Public Records
Map
Nearby Homes
- 4772 S Old 3c Hwy
- 4703 Talus Rd
- 5287 Genoa Farms Blvd
- 5349 Slater Ridge Unit 5349
- 7380 Lewis Center Rd
- 6398 Garden Loop
- 6192 Garden Loop
- 6206 Garden Loop
- 5645 Covington Meadows Dr
- 6677 Via Florenza Dr
- 7513 Upper Cambridge Way
- 5217 Sierra Dr
- 5833 S Old 3c Hwy
- 6059 Victory Ln
- 6024 Victory Ln
- 6623 Henschen Cir
- 5714 Braymoore Dr
- 6045 Medallion Dr W
- 5632 Edgebrook Dr
- 6136 Keats Place
- 7360 Marrisey Loop Unit 7472
- 7376 Marrisey Loop
- 7346 Marrisey Loop
- 7398 Marrisey Loop
- 7398 Marrisey Loop Unit 7474
- 7326 Marrisey Loop
- 7365 Marrisey Loop
- 7377 Marrisey Loop
- 7427 Seraphim Ct Unit 7493
- 7515 Presidium Loop
- 7515 Presidium Loop Unit 7217
- 7525 Presidium Loop
- 7389 Marrisey Loop
- 7497 Presidium Loop
- 7497 Presidium Loop Unit 7216
- 7426 Marrisey Loop
- 7390 Seraphim Ct
- 7403 Marrisey Loop Unit 7475
- 7411 Seraphim Ct
- 7323 Marrisey Loop
Your Personal Tour Guide
Ask me questions while you tour the home.