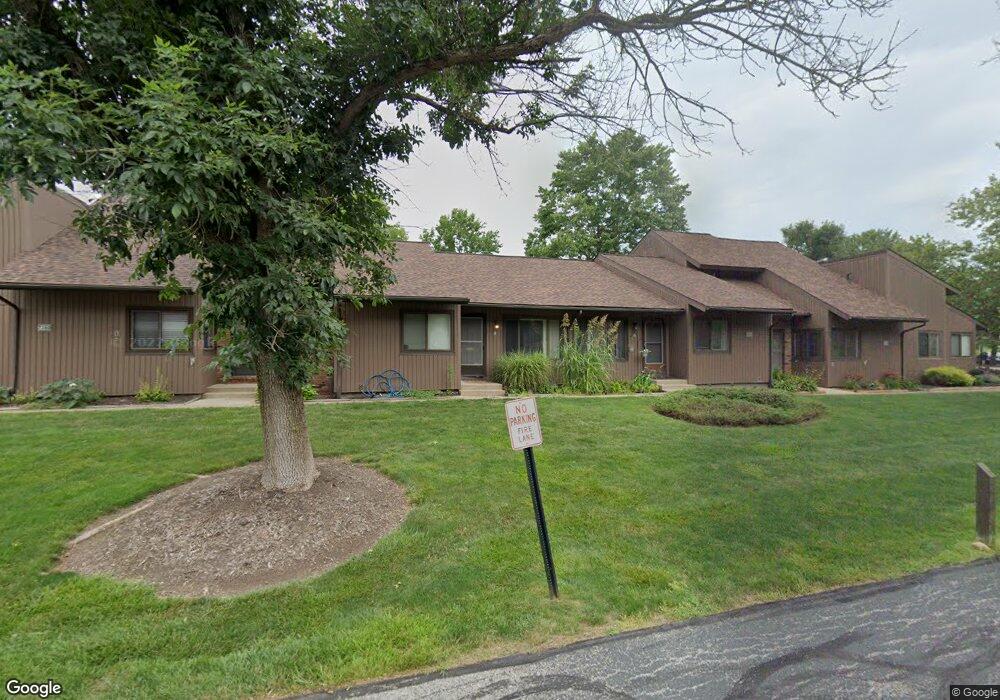
7360 Trailside Dr Northfield, OH 44067
Estimated Value: $139,000 - $173,000
2
Beds
1
Bath
1,088
Sq Ft
$142/Sq Ft
Est. Value
About This Home
This home is located at 7360 Trailside Dr, Northfield, OH 44067 and is currently estimated at $154,429, approximately $141 per square foot. 7360 Trailside Dr is a home located in Summit County with nearby schools including Lee Eaton Elementary School, Nordonia Middle School, and Nordonia High School.
Ownership History
Date
Name
Owned For
Owner Type
Purchase Details
Closed on
Aug 3, 2017
Sold by
Kvet Ralph and Kvet Linda
Bought by
Chrustyna Barbara A
Current Estimated Value
Home Financials for this Owner
Home Financials are based on the most recent Mortgage that was taken out on this home.
Original Mortgage
$64,800
Outstanding Balance
$53,983
Interest Rate
3.9%
Mortgage Type
New Conventional
Estimated Equity
$100,446
Purchase Details
Closed on
Mar 13, 2002
Sold by
Kvet Ruth Ann
Bought by
Kvet Ralph
Home Financials for this Owner
Home Financials are based on the most recent Mortgage that was taken out on this home.
Original Mortgage
$85,000
Interest Rate
6.31%
Purchase Details
Closed on
Nov 15, 1998
Sold by
Maimone Nancy A and Nancy Halpin M
Bought by
Kvet Ruth Ann
Home Financials for this Owner
Home Financials are based on the most recent Mortgage that was taken out on this home.
Original Mortgage
$79,150
Interest Rate
6.59%
Mortgage Type
FHA
Create a Home Valuation Report for This Property
The Home Valuation Report is an in-depth analysis detailing your home's value as well as a comparison with similar homes in the area
Home Values in the Area
Average Home Value in this Area
Purchase History
| Date | Buyer | Sale Price | Title Company |
|---|---|---|---|
| Chrustyna Barbara A | $72,000 | None Available | |
| Kvet Ralph | $85,000 | Cardinal Title Company | |
| Kvet Ruth Ann | $81,000 | Approved Statewide Title Age |
Source: Public Records
Mortgage History
| Date | Status | Borrower | Loan Amount |
|---|---|---|---|
| Open | Chrustyna Barbara A | $64,800 | |
| Previous Owner | Kvet Ralph | $85,000 | |
| Previous Owner | Kvet Ruth Ann | $79,150 |
Source: Public Records
Tax History Compared to Growth
Tax History
| Year | Tax Paid | Tax Assessment Tax Assessment Total Assessment is a certain percentage of the fair market value that is determined by local assessors to be the total taxable value of land and additions on the property. | Land | Improvement |
|---|---|---|---|---|
| 2025 | $1,690 | $41,913 | $5,828 | $36,085 |
| 2024 | $1,690 | $41,913 | $5,828 | $36,085 |
| 2023 | $1,690 | $41,913 | $5,828 | $36,085 |
| 2022 | $1,730 | $27,224 | $3,714 | $23,510 |
| 2021 | $1,696 | $27,224 | $3,714 | $23,510 |
| 2020 | $1,669 | $27,220 | $3,710 | $23,510 |
| 2019 | $1,589 | $23,250 | $3,640 | $19,610 |
| 2018 | $1,404 | $23,250 | $3,640 | $19,610 |
| 2017 | $1,263 | $23,250 | $3,640 | $19,610 |
| 2016 | $1,263 | $20,210 | $3,640 | $16,570 |
| 2015 | $1,263 | $20,210 | $3,640 | $16,570 |
| 2014 | $1,256 | $20,210 | $3,640 | $16,570 |
| 2013 | $1,818 | $29,980 | $3,640 | $26,340 |
Source: Public Records
Map
Nearby Homes
- 1090 Fleetwood Dr
- 1105 Canyon View Rd Unit 106
- 6280 Greenwood Pkwy Unit 105
- 6280 Greenwood Pkwy Unit 202
- 6270 Greenwood Pkwy Unit 402
- 985 Canyon View Rd Unit 204
- 6320 Greenwood Pkwy Unit 100-4
- 6290 Greenwood Pkwy Unit 302
- 6310 Greenwood Pkwy Unit 301
- 1036 Canyon View Rd
- 938 Trimble Place Unit 3002H
- 842 Arboretum Cir
- 845 Arboretum Cir
- 804 Arboretum Cir Unit 804
- 874 Hemlock Ln
- 7571 Silverleaf Ct
- 701 Village Club Rd
- 628 Windsor Ln
- 7840 Carter Rd
- 7669 Locust Cir
- 7360 Trailside Dr
- 7360 Trailside Dr Unit 10D
- 7360 Trailside Dr
- 7360 Trailside Dr
- 7360 Trailside Dr
- 7360 Trailside Dr Unit 10E
- 7360 Trailside Dr Unit D
- 7360 Trailside Dr Unit E
- 7360 Trailside Dr Unit F
- 7360 Trailside Dr Unit A
- 7360 Trailside Dr Unit B
- 7360 Trailside Dr Unit C
- 7360 Trailside Dr Unit 8
- 7360 Trailside Dr Unit 10F
- 7368 Trailside Dr
- 7368 Trailside Dr
- 7368 Trailside Dr
- 7368 Trailside Dr
- 7368 Trailside Dr
- 7368 Trailside Dr