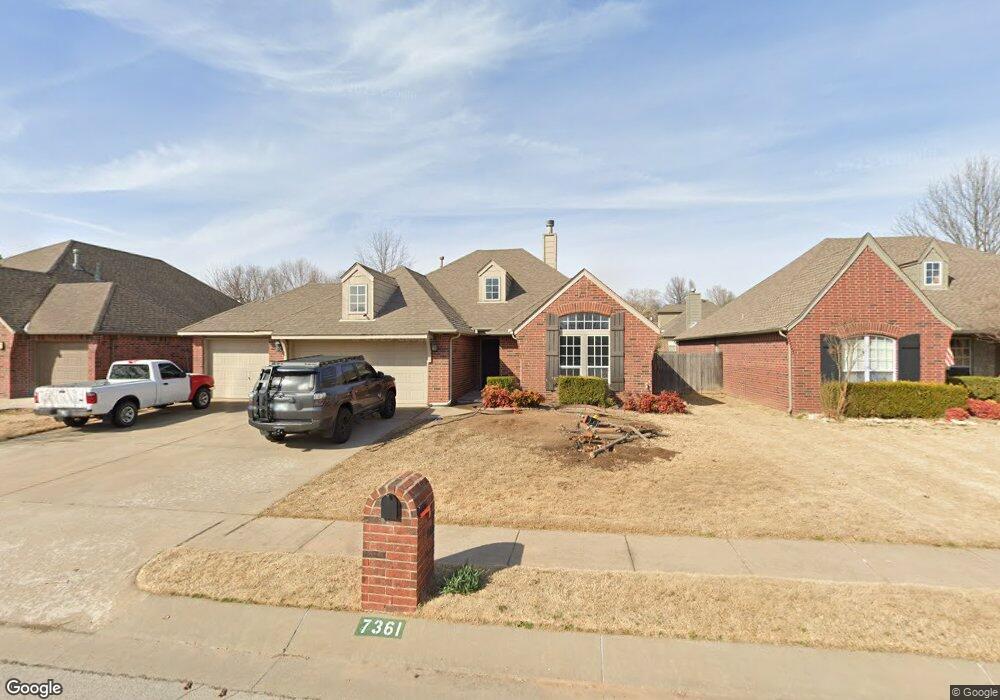
7361 E 119th Place S Bixby, OK 74008
North Bixby NeighborhoodEstimated Value: $307,523 - $346,000
Studio
2
Baths
1,863
Sq Ft
$175/Sq Ft
Est. Value
About This Home
This home is located at 7361 E 119th Place S, Bixby, OK 74008 and is currently estimated at $326,381, approximately $175 per square foot. 7361 E 119th Place S is a home located in Tulsa County with nearby schools including Bixby North Elementary, Bixby North Intermediate, and Bixby Middle School.
Ownership History
Date
Name
Owned For
Owner Type
Purchase Details
Closed on
Oct 7, 2021
Sold by
Chubb Richard Bryan and Chubb Liana N
Bought by
Tuangneu Jude and Khawl Cing Hoih
Current Estimated Value
Home Financials for this Owner
Home Financials are based on the most recent Mortgage that was taken out on this home.
Original Mortgage
$239,400
Outstanding Balance
$215,928
Interest Rate
2.8%
Mortgage Type
New Conventional
Estimated Equity
$110,453
Purchase Details
Closed on
May 31, 2013
Sold by
Chubb Richard B
Bought by
Chubb Richard B and Chubb Liana N
Purchase Details
Closed on
Apr 7, 2005
Sold by
Terry L Davis Homes Inc
Bought by
Chubb Richard Bryan
Home Financials for this Owner
Home Financials are based on the most recent Mortgage that was taken out on this home.
Original Mortgage
$129,544
Interest Rate
5.78%
Mortgage Type
Fannie Mae Freddie Mac
Create a Home Valuation Report for This Property
The Home Valuation Report is an in-depth analysis detailing your home's value as well as a comparison with similar homes in the area
Home Values in the Area
Average Home Value in this Area
Purchase History
| Date | Buyer | Sale Price | Title Company |
|---|---|---|---|
| Tuangneu Jude | $252,000 | Community Title Services | |
| Chubb Richard B | -- | None Available | |
| Chubb Richard Bryan | $162,000 | -- |
Source: Public Records
Mortgage History
| Date | Status | Borrower | Loan Amount |
|---|---|---|---|
| Open | Tuangneu Jude | $239,400 | |
| Previous Owner | Chubb Richard Bryan | $129,544 |
Source: Public Records
Tax History
| Year | Tax Paid | Tax Assessment Tax Assessment Total Assessment is a certain percentage of the fair market value that is determined by local assessors to be the total taxable value of land and additions on the property. | Land | Improvement |
|---|---|---|---|---|
| 2025 | $4,283 | $31,232 | $3,815 | $27,417 |
| 2024 | $4,072 | $29,745 | $3,908 | $25,837 |
| 2023 | $4,072 | $29,106 | $3,884 | $25,222 |
| 2022 | $3,895 | $27,720 | $3,908 | $23,812 |
| 2021 | $2,820 | $21,470 | $3,734 | $17,736 |
| 2020 | $2,782 | $21,052 | $3,661 | $17,391 |
| 2019 | $2,707 | $20,409 | $3,549 | $16,860 |
| 2018 | $2,600 | $19,786 | $3,441 | $16,345 |
| 2017 | $2,505 | $20,181 | $3,510 | $16,671 |
| 2016 | $2,399 | $19,592 | $3,407 | $16,185 |
| 2015 | $2,224 | $22,470 | $3,908 | $18,562 |
| 2014 | $2,152 | $19,185 | $3,908 | $15,277 |
Source: Public Records
Map
Nearby Homes
- 7334 E 119th St S
- 7358 E 119th Place S
- 11702 S 75th East Ave
- 11618 S 74th East Ave
- 6828 E 118th St S
- 11939 S 68th East Ave
- 12010 S 68th East Ave
- 6902 E 115th Place S
- 12050 S 68th East Ave
- 11561 S 68th East Ave
- 11579 S 67th East Ave
- 11343 S 75th East Ave
- 11340 S 75th East Ave
- 11285 S 73rd Place E
- 11328 S 75th East Ave
- 12505 S 71st East Ave
- 7004 E 124th St S
- 7315 E 112th Place S
- 6678 E 123rd Place S
- 11401 S 67th East Ave
- 7365 E 119th Place S
- 7357 E 119th Place S
- 7369 E 119th Place S
- 7353 E 119th Place S
- 7358 E 119th St S
- 7350 E 119th St S
- 7354 E 119th Place S
- 7346 E 119th St S
- 7350 E 119th Place S
- 7373 E 119th Place S
- 7346 E 119th Place S
- 0 E 119th Place Unit 1933042
- 0 E 119th Place Unit 1933038
- 0 E 119th Place Unit 2008006
- 0 E 119th Place Unit 2008004
- 7366 E 119th St S
- 7342 E 119th St S
- 7345 E 119th Place S
- 7366 E 119th Place S
- 7377 E 119th Place S
Your Personal Tour Guide
Ask me questions while you tour the home.