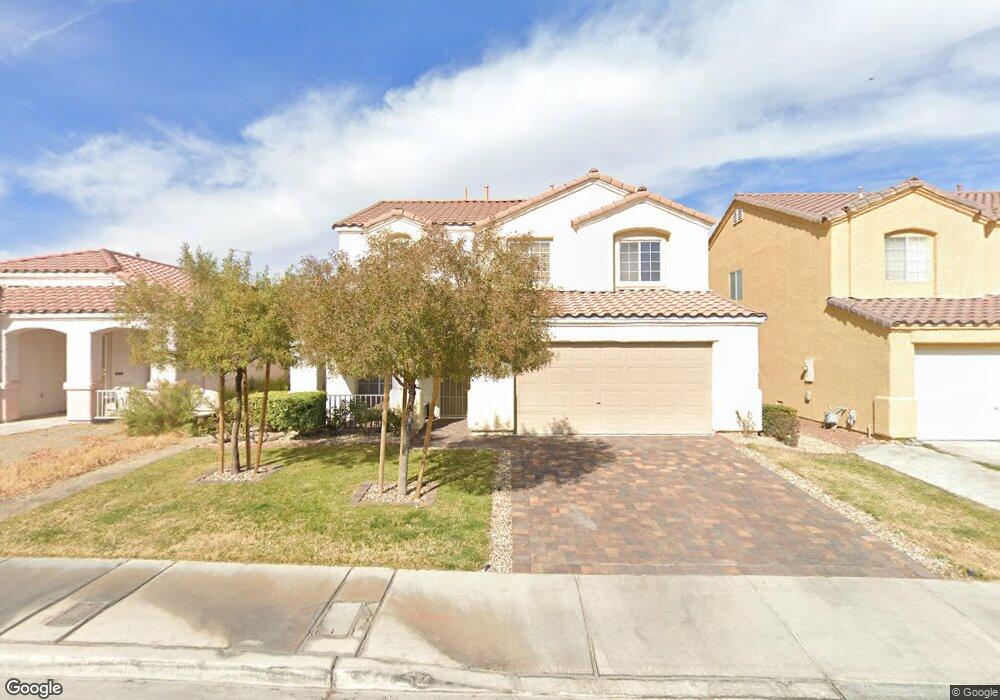
7362 W Diablo Dr Las Vegas, NV 89113
Estimated Value: $469,000 - $511,536
4
Beds
3
Baths
1,910
Sq Ft
$258/Sq Ft
Est. Value
About This Home
This home is located at 7362 W Diablo Dr, Las Vegas, NV 89113 and is currently estimated at $491,884, approximately $257 per square foot. 7362 W Diablo Dr is a home located in Clark County with nearby schools including Lucille S. Rogers Elementary School, Grant Sawyer Middle School, and Durango High School.
Ownership History
Date
Name
Owned For
Owner Type
Purchase Details
Closed on
Jun 9, 2020
Sold by
Byrd Robert and Byrd Mary J
Bought by
Byrd Robert
Current Estimated Value
Home Financials for this Owner
Home Financials are based on the most recent Mortgage that was taken out on this home.
Original Mortgage
$276,000
Outstanding Balance
$194,026
Interest Rate
3.2%
Mortgage Type
New Conventional
Estimated Equity
$297,858
Purchase Details
Closed on
Mar 25, 2002
Sold by
Lloraine Llc
Bought by
Byrd Robert S and Byrd Mary J
Home Financials for this Owner
Home Financials are based on the most recent Mortgage that was taken out on this home.
Original Mortgage
$137,600
Interest Rate
9.74%
Purchase Details
Closed on
Jan 25, 2000
Sold by
Kaufman & Broad Of Nevada Inc
Bought by
L Loraine Llc
Home Financials for this Owner
Home Financials are based on the most recent Mortgage that was taken out on this home.
Original Mortgage
$119,704
Interest Rate
4.35%
Create a Home Valuation Report for This Property
The Home Valuation Report is an in-depth analysis detailing your home's value as well as a comparison with similar homes in the area
Home Values in the Area
Average Home Value in this Area
Purchase History
| Date | Buyer | Sale Price | Title Company |
|---|---|---|---|
| Byrd Robert | -- | Old Republic Title Co Of Nv | |
| Byrd Robert S | $172,000 | Old Republic Title Company | |
| L Loraine Llc | $149,630 | United Title |
Source: Public Records
Mortgage History
| Date | Status | Borrower | Loan Amount |
|---|---|---|---|
| Open | Byrd Robert | $276,000 | |
| Closed | Byrd Robert S | $137,600 | |
| Previous Owner | L Loraine Llc | $119,704 | |
| Closed | Byrd Robert S | $34,400 |
Source: Public Records
Tax History Compared to Growth
Tax History
| Year | Tax Paid | Tax Assessment Tax Assessment Total Assessment is a certain percentage of the fair market value that is determined by local assessors to be the total taxable value of land and additions on the property. | Land | Improvement |
|---|---|---|---|---|
| 2025 | $2,435 | $130,849 | $40,250 | $90,599 |
| 2024 | $2,678 | $130,849 | $40,250 | $90,599 |
| 2023 | $2,084 | $116,127 | $30,800 | $85,327 |
| 2022 | $2,517 | $108,147 | $29,750 | $78,397 |
| 2021 | $2,903 | $102,537 | $28,000 | $74,537 |
| 2020 | $2,161 | $98,330 | $24,500 | $73,830 |
| 2019 | $2,025 | $94,438 | $21,700 | $72,738 |
| 2018 | $1,932 | $88,527 | $18,550 | $69,977 |
| 2017 | $2,587 | $88,220 | $17,150 | $71,070 |
| 2016 | $2,084 | $81,340 | $10,500 | $70,840 |
| 2015 | $2,080 | $66,310 | $8,750 | $57,560 |
| 2014 | $2,027 | $57,978 | $7,700 | $50,278 |
Source: Public Records
Map
Nearby Homes
- 5470 Logville St
- 7345 Aspire Ct
- 7507 Pink Mimosa Ave
- 7449 W Dewey Dr
- 7482 Lodano Ave
- 5678 Spring Trellis St
- 5680 Scottyboy Dr
- 7280 Saxby Ave
- 7413 W Russell Rd Unit 254
- 5734 Prima St
- 20 Wild Dunes Ct
- 21 Sawgrass Ct
- 7086 Parkallen Ave
- 7071 Sombra Way
- 7058 Baza Ave
- 5304 Luna Bonita St
- 7232 Deer View Ct
- 5390 Cielo Oro St
- 32 Princeville Ln
- 7707 Mocorito Ave
- 7370 W Diablo Dr
- 7354 W Diablo Dr
- 7378 W Diablo Dr
- 7371 Standing Timber Way
- 7379 Standing Timber Way
- 7386 W Diablo Dr
- 5506 Summer Joy St
- 7387 Standing Timber Way
- 7394 W Diablo Dr
- 5516 Summer Joy St
- 7383 W Diablo Dr
- 5460 Logville St
- 7395 Standing Timber Way
- 7391 W Diablo Dr
- 5526 Summer Joy St
- 5450 Logville St
- 7399 W Diablo Dr
- 5536 Summer Joy St
- 7380 Standing Timber Way
- 5527 Summer Joy St