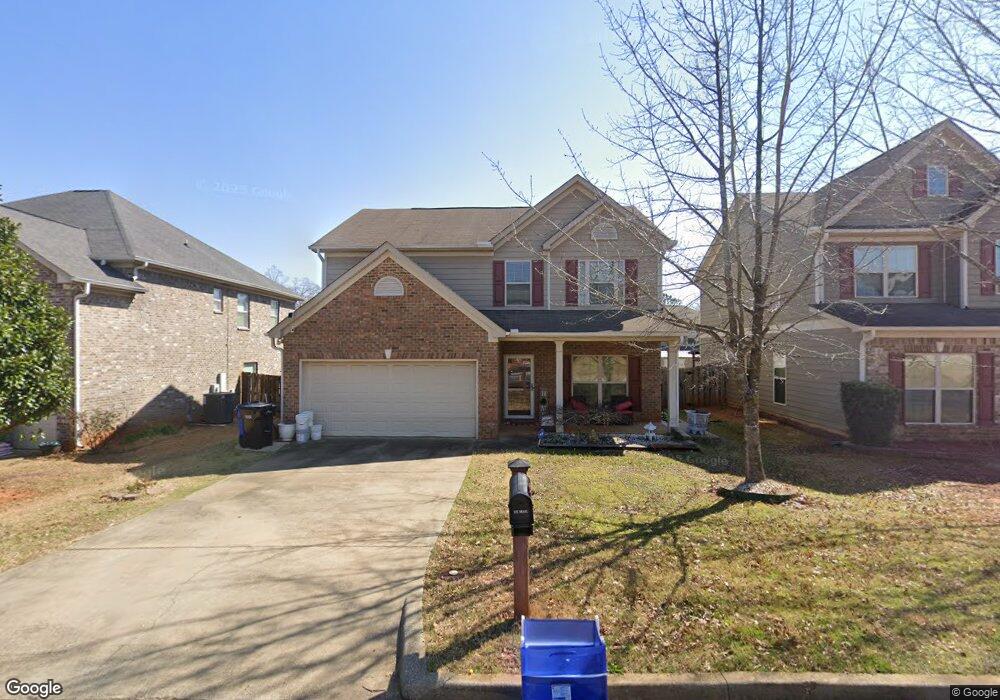
7364 Sorrel Ct Columbus, GA 31909
Midland NeighborhoodEstimated Value: $287,016 - $309,000
4
Beds
3
Baths
2,157
Sq Ft
$140/Sq Ft
Est. Value
About This Home
This home is located at 7364 Sorrel Ct, Columbus, GA 31909 and is currently estimated at $302,504, approximately $140 per square foot. 7364 Sorrel Ct is a home with nearby schools including Midland Academy, Blackmon Road Middle School, and Shaw High School.
Ownership History
Date
Name
Owned For
Owner Type
Purchase Details
Closed on
Oct 20, 2017
Sold by
Ngo Cuong T
Bought by
Tran Thanh H and Nguyen Nhu Linh T
Current Estimated Value
Home Financials for this Owner
Home Financials are based on the most recent Mortgage that was taken out on this home.
Original Mortgage
$177,943
Outstanding Balance
$148,831
Interest Rate
3.87%
Mortgage Type
FHA
Estimated Equity
$153,673
Purchase Details
Closed on
Mar 14, 2014
Sold by
Ly Robert M
Bought by
Tran Thanh H and Ngo Cuong T
Home Financials for this Owner
Home Financials are based on the most recent Mortgage that was taken out on this home.
Original Mortgage
$177,859
Interest Rate
4.25%
Mortgage Type
FHA
Purchase Details
Closed on
Jun 29, 2011
Sold by
Grayhawk Homes Inc
Bought by
Ly Robert M
Home Financials for this Owner
Home Financials are based on the most recent Mortgage that was taken out on this home.
Original Mortgage
$148,250
Interest Rate
3.25%
Mortgage Type
New Conventional
Create a Home Valuation Report for This Property
The Home Valuation Report is an in-depth analysis detailing your home's value as well as a comparison with similar homes in the area
Home Values in the Area
Average Home Value in this Area
Purchase History
| Date | Buyer | Sale Price | Title Company |
|---|---|---|---|
| Tran Thanh H | -- | -- | |
| Tran Thanh H | $185,800 | -- | |
| Ly Robert M | $185,342 | -- |
Source: Public Records
Mortgage History
| Date | Status | Borrower | Loan Amount |
|---|---|---|---|
| Open | Tran Thanh H | $177,943 | |
| Previous Owner | Tran Thanh H | $177,859 | |
| Previous Owner | Ly Robert M | $148,250 |
Source: Public Records
Tax History Compared to Growth
Tax History
| Year | Tax Paid | Tax Assessment Tax Assessment Total Assessment is a certain percentage of the fair market value that is determined by local assessors to be the total taxable value of land and additions on the property. | Land | Improvement |
|---|---|---|---|---|
| 2025 | $2,393 | $95,700 | $13,144 | $82,556 |
| 2024 | $2,392 | $95,700 | $13,144 | $82,556 |
| 2023 | $1,713 | $95,700 | $13,144 | $82,556 |
| 2022 | $2,495 | $75,892 | $13,144 | $62,748 |
| 2021 | $2,488 | $74,940 | $13,144 | $61,796 |
| 2020 | $2,489 | $74,940 | $13,144 | $61,796 |
| 2019 | $2,498 | $74,940 | $13,144 | $61,796 |
| 2018 | $2,498 | $74,940 | $13,144 | $61,796 |
| 2017 | $2,508 | $74,940 | $13,144 | $61,796 |
| 2016 | $2,518 | $74,320 | $12,800 | $61,520 |
| 2015 | $2,522 | $74,320 | $12,800 | $61,520 |
| 2014 | $3,066 | $74,136 | $12,800 | $61,336 |
| 2013 | -- | $74,136 | $12,800 | $61,336 |
Source: Public Records
Map
Nearby Homes
- 7389 Sorrel Ct
- 8095 Santee Ct
- 8042 Sonoma Pointe Dr
- 6055 Townes Way
- 6036 Townes Way
- 7076 Stoneybrook Dr
- 7056 Stoneybrook Dr
- 7020 Stoneridge Cir
- 5135 Midland Trace
- 6454 Patriot Dr
- 5110 Midland Trc
- 5110 Midland Trace
- 7168 Pinewood Ct
- 6528 Yellow Stone Ct
- 7113 Pinewood Ct
- 209 Plum Ct
- 8051 Chapel Lake Dr
- 6222 Goodwin Dr
- 6 Jamestown Ct
- 7101 Cross Tie Dr
- 7368 Sorrel Ct
- 7360 Sorrel Ct
- 7356 Sorrel Ct
- 7367 San Vista Dr
- 7371 San Vista Dr
- 7365 Sorrel Ct
- 7369 Sorrel Ct
- 7361 Sorrel Ct
- 7352 Sorrel Ct
- 7357 San Vista Dr
- 7355 Sorrel Ct
- 7376 Sorrel Ct
- 7351 Sorrel Ct
- 7379 San Vista Dr
- 7377 Sorrel Ct
- 7353 San Vista Dr
- 7380 Sorrel Ct
- 7347 San Vista Dr
- 7345 Sorrel Ct
- 9024 Sante fe Ct