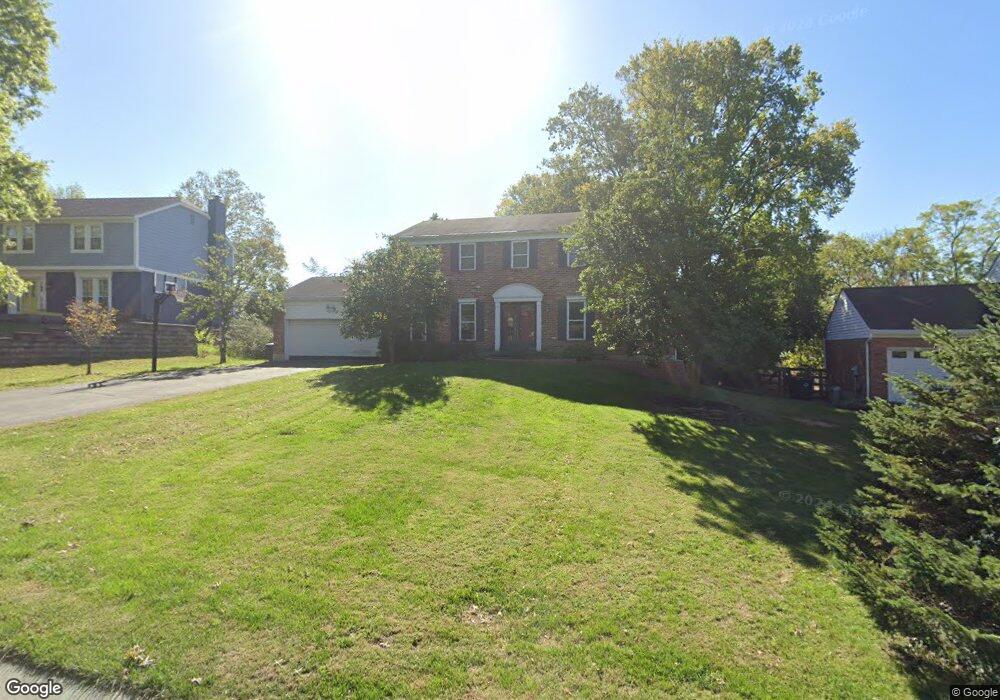
7365 Rudgate Ct Cincinnati, OH 45244
Turpin Hills NeighborhoodEstimated Value: $504,000 - $540,816
4
Beds
3
Baths
2,457
Sq Ft
$214/Sq Ft
Est. Value
About This Home
This home is located at 7365 Rudgate Ct, Cincinnati, OH 45244 and is currently estimated at $525,454, approximately $213 per square foot. 7365 Rudgate Ct is a home located in Hamilton County with nearby schools including Wilson Elementary School, Nagel Middle School, and Turpin High School.
Ownership History
Date
Name
Owned For
Owner Type
Purchase Details
Closed on
Nov 10, 2008
Sold by
Barger Ronald C and Barger Carol A
Bought by
Bosse Bryan G and Bosse Gretchen A
Current Estimated Value
Home Financials for this Owner
Home Financials are based on the most recent Mortgage that was taken out on this home.
Original Mortgage
$198,400
Outstanding Balance
$129,395
Interest Rate
5.95%
Mortgage Type
New Conventional
Estimated Equity
$396,059
Purchase Details
Closed on
Jul 26, 2002
Sold by
Dehlinger Michael J and Dehlinger Cynthia W
Bought by
Barger Ronald C and Barger Carol A
Home Financials for this Owner
Home Financials are based on the most recent Mortgage that was taken out on this home.
Original Mortgage
$173,400
Interest Rate
6.64%
Purchase Details
Closed on
Sep 14, 1999
Sold by
Dietz Lester J and Dietz Janice C
Bought by
Dehlinger Michael J and Dehlinger Cynthia W
Home Financials for this Owner
Home Financials are based on the most recent Mortgage that was taken out on this home.
Original Mortgage
$170,000
Interest Rate
7%
Create a Home Valuation Report for This Property
The Home Valuation Report is an in-depth analysis detailing your home's value as well as a comparison with similar homes in the area
Home Values in the Area
Average Home Value in this Area
Purchase History
| Date | Buyer | Sale Price | Title Company |
|---|---|---|---|
| Bosse Bryan G | $248,000 | Attorney | |
| Barger Ronald C | $204,000 | -- | |
| Dehlinger Michael J | $200,000 | Title First Agency Inc |
Source: Public Records
Mortgage History
| Date | Status | Borrower | Loan Amount |
|---|---|---|---|
| Open | Bosse Bryan G | $198,400 | |
| Previous Owner | Barger Ronald C | $173,400 | |
| Previous Owner | Dehlinger Michael J | $170,000 |
Source: Public Records
Tax History Compared to Growth
Tax History
| Year | Tax Paid | Tax Assessment Tax Assessment Total Assessment is a certain percentage of the fair market value that is determined by local assessors to be the total taxable value of land and additions on the property. | Land | Improvement |
|---|---|---|---|---|
| 2024 | $9,352 | $153,965 | $28,875 | $125,090 |
| 2023 | $8,895 | $153,965 | $28,875 | $125,090 |
| 2022 | $8,026 | $123,712 | $19,184 | $104,528 |
| 2021 | $7,837 | $123,712 | $19,184 | $104,528 |
| 2020 | $7,927 | $123,712 | $19,184 | $104,528 |
| 2019 | $7,727 | $109,477 | $16,975 | $92,502 |
| 2018 | $7,238 | $97,227 | $16,975 | $80,252 |
| 2017 | $6,065 | $97,227 | $16,975 | $80,252 |
| 2016 | $5,985 | $93,744 | $17,010 | $76,734 |
| 2015 | $5,813 | $93,744 | $17,010 | $76,734 |
| 2014 | $5,816 | $93,744 | $17,010 | $76,734 |
| 2013 | $5,094 | $86,800 | $15,750 | $71,050 |
Source: Public Records
Map
Nearby Homes
- 2295 Donnington Ln
- 2193 Flaxen Ct
- 2121 Clough Chase Dr
- 2201 Candlemaker Dr
- 2105 Clough Chase Dr
- Madison Plan at Clough Chase
- Remington Plan at Clough Chase
- Manchester II Plan at Clough Chase
- Rockwood Plan at Clough Chase
- Charleston Plan at Clough Chase
- Denison Plan at Clough Chase
- Tacoma Plan at Clough Chase
- Patterson Plan at Clough Chase
- Devonshire II Plan at Clough Chase
- Oberlin Plan at Clough Chase
- Marquette Plan at Clough Chase
- 7392 Hunley Rd
- 7443 Towerview Ln
- 7154 Goldengate Dr
- 2373 Wolfangel Rd
- 7357 Rudgate Ct
- 7359 Rudgate Ct
- 7371 Rudgate Ct
- 2235 Bretton Dr
- 2227 Bretton Dr
- 2243 Bretton Dr
- 7353 Rudgate Ct
- 7377 Rudgate Ct
- 7362 Rudgate Ct
- 7354 Rudgate Ct
- 2251 Bretton Dr
- 2244 Donnington Ln
- 7378 Rudgate Ct
- 7383 Rudgate Ct
- 2278 Donnington Ln
- 2232 Bretton Dr
- 7384 Rudgate Ct
- 2226 Bretton Dr
- 7389 Rudgate Ct
- 2259 Donnington Ln