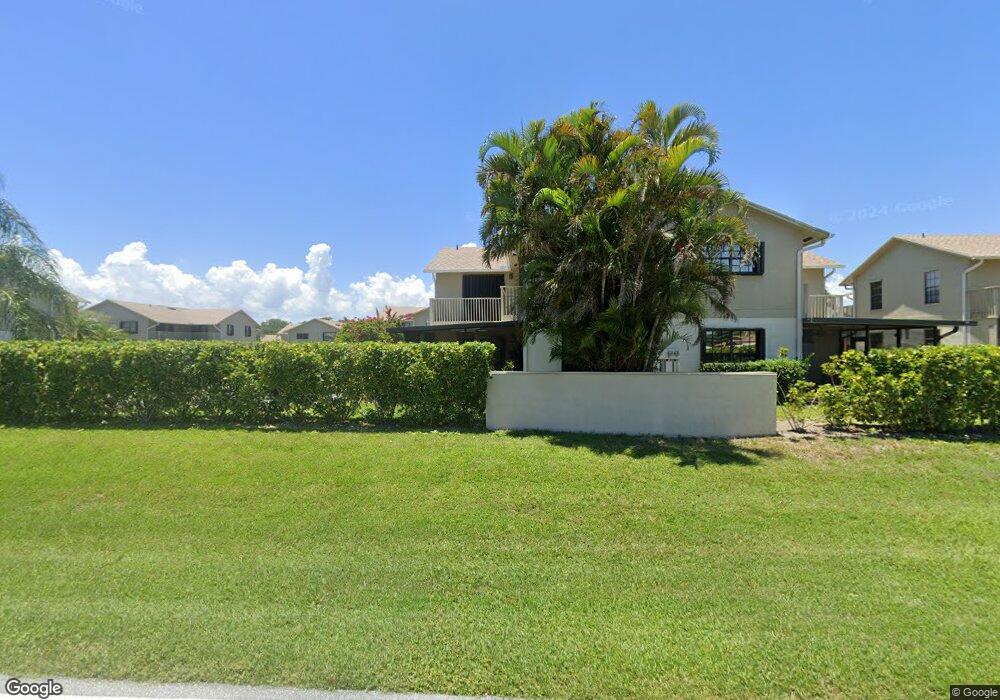
7365 SE Concord Place Unit 603 Hobe Sound, FL 33455
Estimated Value: $176,000 - $263,000
2
Beds
2
Baths
1,384
Sq Ft
$167/Sq Ft
Est. Value
About This Home
This home is located at 7365 SE Concord Place Unit 603, Hobe Sound, FL 33455 and is currently estimated at $231,008, approximately $166 per square foot. 7365 SE Concord Place Unit 603 is a home located in Martin County with nearby schools including Sea Wind Elementary School, Murray Middle School, and South Fork High School.
Ownership History
Date
Name
Owned For
Owner Type
Purchase Details
Closed on
Dec 23, 2010
Sold by
Karnbach Mary E
Bought by
Zurhellen Robert F
Current Estimated Value
Home Financials for this Owner
Home Financials are based on the most recent Mortgage that was taken out on this home.
Original Mortgage
$50,400
Outstanding Balance
$33,636
Interest Rate
4.42%
Mortgage Type
New Conventional
Estimated Equity
$197,372
Purchase Details
Closed on
Aug 2, 1996
Sold by
Matlack Kenneth P and Matlack Deborah L
Bought by
Karnbach Mary E
Purchase Details
Closed on
Mar 24, 1995
Sold by
Weida Michael C
Bought by
Matlack Kenneth P and Matlack Deborah L
Home Financials for this Owner
Home Financials are based on the most recent Mortgage that was taken out on this home.
Original Mortgage
$61,963
Interest Rate
8.86%
Mortgage Type
FHA
Create a Home Valuation Report for This Property
The Home Valuation Report is an in-depth analysis detailing your home's value as well as a comparison with similar homes in the area
Home Values in the Area
Average Home Value in this Area
Purchase History
| Date | Buyer | Sale Price | Title Company |
|---|---|---|---|
| Zurhellen Robert F | $72,000 | South Florida Title Svcs Inc | |
| Karnbach Mary E | $67,500 | -- | |
| Matlack Kenneth P | $62,000 | -- |
Source: Public Records
Mortgage History
| Date | Status | Borrower | Loan Amount |
|---|---|---|---|
| Open | Zurhellen Robert F | $50,400 | |
| Previous Owner | Matlack Kenneth P | $61,963 |
Source: Public Records
Tax History Compared to Growth
Tax History
| Year | Tax Paid | Tax Assessment Tax Assessment Total Assessment is a certain percentage of the fair market value that is determined by local assessors to be the total taxable value of land and additions on the property. | Land | Improvement |
|---|---|---|---|---|
| 2025 | $2,665 | $163,040 | -- | -- |
| 2024 | $2,493 | $148,219 | -- | -- |
| 2023 | $2,493 | $134,745 | $0 | $0 |
| 2022 | $2,072 | $122,496 | $0 | $0 |
| 2021 | $1,926 | $111,360 | $47,500 | $63,860 |
| 2020 | $1,819 | $104,230 | $38,000 | $66,230 |
| 2019 | $1,756 | $100,020 | $31,350 | $68,670 |
| 2018 | $1,582 | $90,030 | $28,500 | $61,530 |
| 2017 | $1,475 | $87,510 | $38,000 | $49,510 |
| 2016 | $1,498 | $89,140 | $38,000 | $51,140 |
| 2015 | $1,186 | $80,410 | $28,500 | $51,910 |
| 2014 | $1,186 | $72,250 | $16,000 | $56,250 |
Source: Public Records
Map
Nearby Homes
- 7456 SE Independence Ave
- 7405 SE Jamestown Terrace Unit Bldg 17
- 7335 SE Independence Ave
- 6686 SE Yorktown Dr
- 6676 SE Yorktown Dr
- 7495 SE Jamestown Terrace
- 7526 SE Independence Ave
- 7398 SE Swan Ave
- 6639 SE Yorktown Dr
- 7359 SE Eagle Ave
- 6757 SE Yorktown Dr
- 6796 SE Yorktown Dr
- 7630 SE Shenandoah Dr
- 6809 SE Yorktown Dr
- 7409 SE Eagle Ave
- 6984 SE Bunker Hill Dr
- 6884 SE Bunker Hill Dr
- 6893 SE Bunker Hill Dr
- 7560 SE Eagle Ave
- 7781 SE Shenandoah Dr
- 7367 SE Concord Place Unit 604
- 7367 SE Concord Place
- 7363 SE Concord Place
- 7361 SE Concord Place Unit Jamestown
- 7361 SE Concord Place
- 7345 SE Concord Place Unit 503
- 7345 SE Concord Place
- 7343 SE Concord Place Unit 502
- 7380 SE Concord Place
- 7382 SE Concord Place
- 7347 SE Concord Place
- 7341 SE Concord Place
- 7407 SE Concord Place Unit 704
- 7407 SE Concord Place
- 7401 SE Concord Place Unit 701
- 7401 SE Concord Place
- 7363 SE Jamestown Terrace Unit 2002
- 7363 SE Jamestown Terrace
- 7386 SE Concord Place Unit 2104
- 7384 SE Concord Place Unit 2103