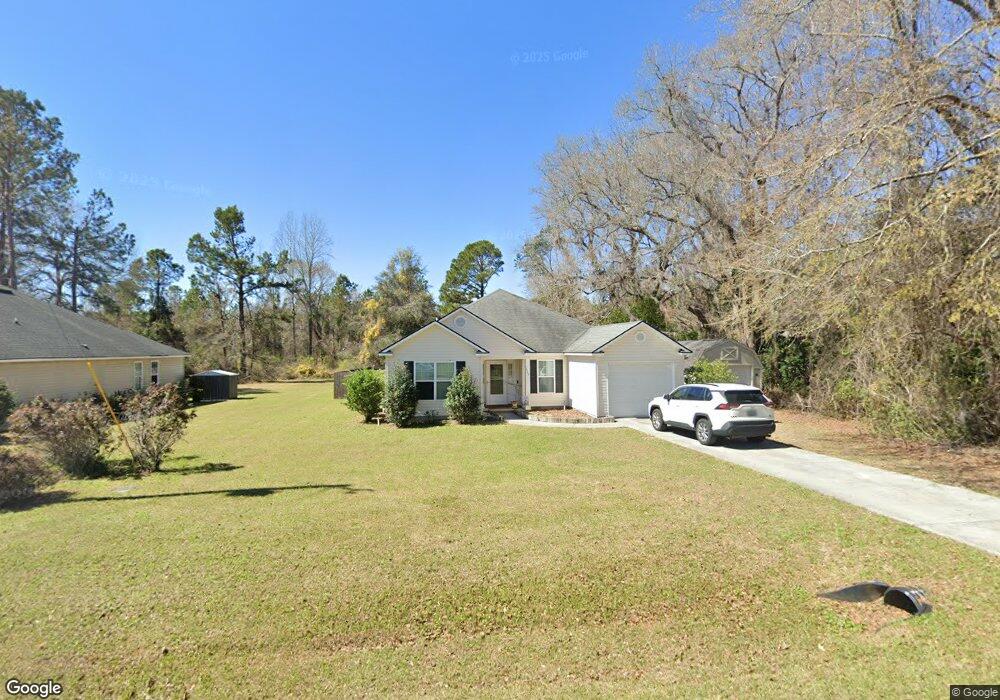
7367 Union Rd Hahira, GA 31632
Estimated Value: $219,000 - $241,000
3
Beds
2
Baths
1,468
Sq Ft
$156/Sq Ft
Est. Value
About This Home
This home is located at 7367 Union Rd, Hahira, GA 31632 and is currently estimated at $228,401, approximately $155 per square foot. 7367 Union Rd is a home located in Lowndes County with nearby schools including Hahira Elementary School, Hahira Middle School, and Lowndes High School.
Ownership History
Date
Name
Owned For
Owner Type
Purchase Details
Closed on
Oct 18, 2019
Sold by
Vieth Joshua Jon
Bought by
Sweat Michael
Current Estimated Value
Home Financials for this Owner
Home Financials are based on the most recent Mortgage that was taken out on this home.
Original Mortgage
$122,069
Outstanding Balance
$107,372
Interest Rate
3.7%
Mortgage Type
VA
Estimated Equity
$121,029
Purchase Details
Closed on
Sep 8, 2017
Sold by
Munoz Alexandria M
Bought by
Vieth Joshua Jon
Purchase Details
Closed on
Mar 16, 2009
Sold by
Tillman Homes Inc
Bought by
Vieth Joshua and Munoz Alexandria M
Home Financials for this Owner
Home Financials are based on the most recent Mortgage that was taken out on this home.
Original Mortgage
$131,125
Interest Rate
5.13%
Mortgage Type
Purchase Money Mortgage
Purchase Details
Closed on
Oct 29, 2008
Sold by
Bennett Charles
Bought by
Tillman Homes Inc
Purchase Details
Closed on
Feb 6, 2004
Bought by
Bennett Charles
Create a Home Valuation Report for This Property
The Home Valuation Report is an in-depth analysis detailing your home's value as well as a comparison with similar homes in the area
Home Values in the Area
Average Home Value in this Area
Purchase History
| Date | Buyer | Sale Price | Title Company |
|---|---|---|---|
| Sweat Michael | $119,500 | -- | |
| Vieth Joshua Jon | -- | -- | |
| Vieth Joshua | $129,000 | -- | |
| Tillman Homes Inc | $25,000 | -- | |
| Bennett Charles | -- | -- |
Source: Public Records
Mortgage History
| Date | Status | Borrower | Loan Amount |
|---|---|---|---|
| Open | Sweat Michael | $122,069 | |
| Previous Owner | Vieth Joshua | $131,125 |
Source: Public Records
Tax History Compared to Growth
Tax History
| Year | Tax Paid | Tax Assessment Tax Assessment Total Assessment is a certain percentage of the fair market value that is determined by local assessors to be the total taxable value of land and additions on the property. | Land | Improvement |
|---|---|---|---|---|
| 2024 | $1,962 | $64,956 | $10,000 | $54,956 |
| 2023 | $1,710 | $55,038 | $10,000 | $45,038 |
| 2022 | $1,234 | $39,645 | $10,000 | $29,645 |
| 2021 | $1,244 | $39,645 | $10,000 | $29,645 |
| 2020 | $1,260 | $39,645 | $10,000 | $29,645 |
| 2019 | $1,147 | $40,880 | $10,000 | $30,880 |
| 2018 | $1,157 | $40,880 | $10,000 | $30,880 |
| 2017 | $1,173 | $40,880 | $10,000 | $30,880 |
| 2016 | $1,176 | $40,880 | $10,000 | $30,880 |
| 2015 | -- | $40,880 | $10,000 | $30,880 |
| 2014 | $1,154 | $40,880 | $10,000 | $30,880 |
Source: Public Records
Map
Nearby Homes
- 0 Union Rd
- 107 Floyd McNeal Dr
- 117 Floyd McNeal Dr
- 7250 Tillman Branch Rd
- 331 Barry Field Cir
- 7305 Wind Chase Dr
- 343 Barry Field Cir
- 168 Floyd McNeal Dr
- 347 Barry Field Cir
- 7325 Wind Chase Dr
- 169 Audrey Ln
- 403 N Church St
- 355 Barry Field Cir
- 374 Barry Field Cir
- 7361 Wind Chase Dr
- 351 Barry Field Cir
- 228 Barry Field Cir
- 117 Sparrow Dr
- 7711 Kayla Dr
- 7398 Woodbend Trail
- 7377 Union Rd
- 7371 Union Rd
- 7355 Union Rd
- 7421 Northcreek Cir
- 7429 Northcreek Cir
- 7417 Northcreek Cir
- 7413 Northcreek Cir
- 7501 Howards End Rd
- 7417 Northcreek Cir
- 7409 Northcreek Cir
- 0 Pettys Rd
- 7422 Northcreek Cir
- 7430 Northcreek Cir
- 7405 Northcreek Cir
- 7350 Union Rd
- 7416 Northcreek Cir
- 7410 Northcreek Cir
- 7352 Northcreek Cir
- 7358 Northcreek Cir
- 7364 Northcreek Cir