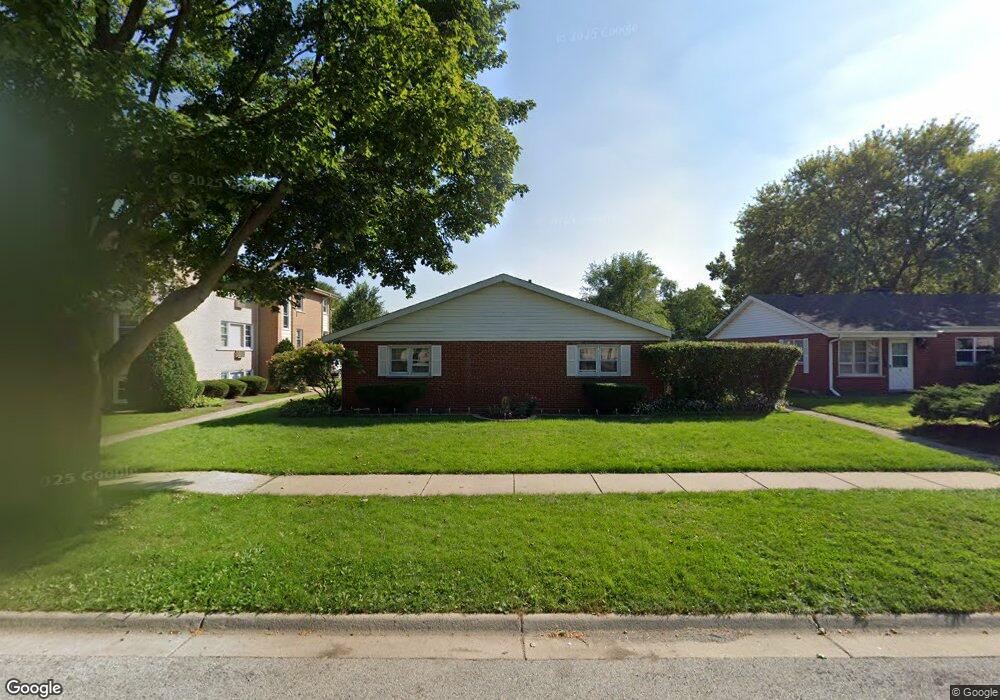
737 Dulles Rd Des Plaines, IL 60016
Estimated Value: $194,000 - $245,853
2
Beds
1
Bath
889
Sq Ft
$254/Sq Ft
Est. Value
About This Home
This home is located at 737 Dulles Rd, Des Plaines, IL 60016 and is currently estimated at $226,213, approximately $254 per square foot. 737 Dulles Rd is a home located in Cook County with nearby schools including Brentwood Elementary School, Friendship Jr High School, and Elk Grove High School.
Ownership History
Date
Name
Owned For
Owner Type
Purchase Details
Closed on
Jan 3, 2018
Sold by
Federal Home Loan Mortgage Corporation
Bought by
Stoykova Diana S
Current Estimated Value
Home Financials for this Owner
Home Financials are based on the most recent Mortgage that was taken out on this home.
Original Mortgage
$97,600
Outstanding Balance
$68,170
Interest Rate
4.12%
Mortgage Type
New Conventional
Estimated Equity
$158,043
Purchase Details
Closed on
Oct 13, 2017
Sold by
Bivian Millan Sharon D
Bought by
Federal Home Loan Mortgage Corporation
Purchase Details
Closed on
Jun 25, 2007
Sold by
Al Pietrussi Ewicz Donna and Al Pietrusi Ewicz
Bought by
Bivian Millan Sharon D
Home Financials for this Owner
Home Financials are based on the most recent Mortgage that was taken out on this home.
Original Mortgage
$175,000
Interest Rate
6.37%
Mortgage Type
Unknown
Create a Home Valuation Report for This Property
The Home Valuation Report is an in-depth analysis detailing your home's value as well as a comparison with similar homes in the area
Home Values in the Area
Average Home Value in this Area
Purchase History
| Date | Buyer | Sale Price | Title Company |
|---|---|---|---|
| Stoykova Diana S | $122,000 | Attorneys Title Guaranty Fun | |
| Federal Home Loan Mortgage Corporation | -- | Attorney | |
| Bivian Millan Sharon D | $175,000 | Cti |
Source: Public Records
Mortgage History
| Date | Status | Borrower | Loan Amount |
|---|---|---|---|
| Open | Stoykova Diana S | $97,600 | |
| Previous Owner | Bivian Millan Sharon D | $175,000 |
Source: Public Records
Tax History
| Year | Tax Paid | Tax Assessment Tax Assessment Total Assessment is a certain percentage of the fair market value that is determined by local assessors to be the total taxable value of land and additions on the property. | Land | Improvement |
|---|---|---|---|---|
| 2025 | $5,447 | $19,000 | $3,864 | $15,136 |
| 2024 | $5,447 | $21,500 | $8,000 | $13,500 |
| 2023 | $4,380 | $21,500 | $8,000 | $13,500 |
| 2022 | $4,380 | $21,500 | $8,000 | $13,500 |
| 2021 | $2,445 | $12,131 | $966 | $11,165 |
| 2020 | $2,454 | $12,131 | $966 | $11,165 |
| 2019 | $2,484 | $13,479 | $966 | $12,513 |
| 2018 | $2,579 | $12,664 | $805 | $11,859 |
| 2017 | $2,549 | $12,664 | $805 | $11,859 |
| 2016 | $2,624 | $12,664 | $805 | $11,859 |
| 2015 | $2,591 | $12,027 | $724 | $11,303 |
| 2014 | $2,577 | $12,027 | $724 | $11,303 |
| 2013 | $2,506 | $12,027 | $724 | $11,303 |
Source: Public Records
Map
Nearby Homes
- 633 Dulles Rd Unit A
- 500 W Huntington Commons Rd Unit 255
- 756 W Millers Rd
- 1103 S Hunt Club Dr Unit 129
- 1101 S Hunt Club Dr Unit 403
- 601 W Huntington Commons Rd Unit 202
- 721 Elmhurst Rd Unit G
- 701 W Huntington Commons Rd Unit 418
- 901 S Can Dota Ave
- 381 W Millers Rd
- 1000 S Na wa ta Ave
- 725 W Huntington Commons Rd Unit 401
- 725 W Huntington Commons Rd Unit 416
- 915 S Owen St
- 508 W Lonnquist Blvd
- 702 W Lonnquist Blvd
- 703 W Manawa Trail
- 909 S Waverly Place
- 930 Beau Dr Unit 312
- 940 Beau Dr Unit 110
- 737 Dulles Rd
- 737 Dulles Rd
- 737 Dulles Rd
- 737 Dulles Rd Unit D
- 737 Dulles Rd Unit C
- 733 Dulles Rd
- 745 Dulles Rd
- 745 Dulles Rd
- 745 Dulles Rd
- 745 Dulles Rd
- 745 Dulles Rd Unit A
- 727 Dulles Rd
- 716 Debra Dr
- 724 Debra Dr
- 732 Debra Dr
- 708 Debra Dr
- 721 Dulles Rd
- 721 Dulles Rd
- 721 Dulles Rd Unit B
- 721 Dulles Rd
Your Personal Tour Guide
Ask me questions while you tour the home.