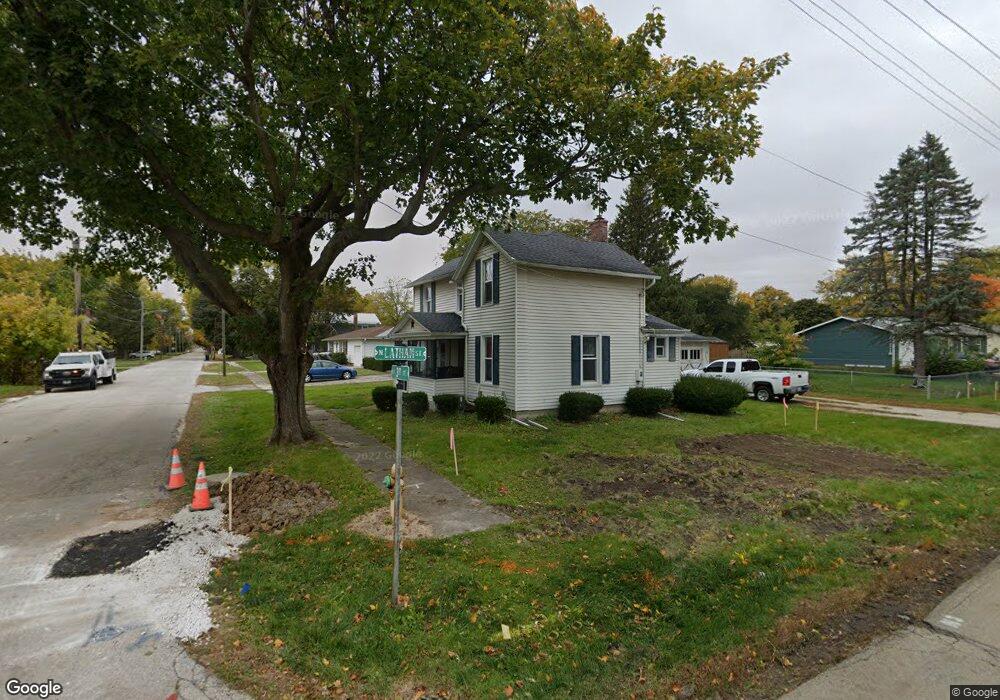
737 E 3rd St Sandwich, IL 60548
Estimated Value: $179,000 - $250,000
2
Beds
1
Bath
--
Sq Ft
8,712
Sq Ft Lot
About This Home
This home is located at 737 E 3rd St, Sandwich, IL 60548 and is currently estimated at $221,805. 737 E 3rd St is a home located in DeKalb County with nearby schools including Sandwich Community High School.
Ownership History
Date
Name
Owned For
Owner Type
Purchase Details
Closed on
Nov 24, 2009
Sold by
Us Bank Na
Bought by
Keckeisen Bill and Keckeisen Nancy
Current Estimated Value
Purchase Details
Closed on
Jul 30, 2009
Sold by
Dekalb County Sheriff
Bought by
Us Bank Na
Purchase Details
Closed on
Jul 29, 2005
Sold by
Tiedemann Anastasia
Bought by
Miller Jodeen
Home Financials for this Owner
Home Financials are based on the most recent Mortgage that was taken out on this home.
Original Mortgage
$30,400
Interest Rate
5.38%
Mortgage Type
New Conventional
Purchase Details
Closed on
Jan 31, 2005
Sold by
Fannie Mae
Bought by
Tiedeman Anastasia and Bice Maryanne
Home Financials for this Owner
Home Financials are based on the most recent Mortgage that was taken out on this home.
Original Mortgage
$70,000
Interest Rate
5.5%
Mortgage Type
New Conventional
Purchase Details
Closed on
Oct 14, 2004
Sold by
Dekalb County Sheriff
Bought by
Federal National Mortgage Association
Create a Home Valuation Report for This Property
The Home Valuation Report is an in-depth analysis detailing your home's value as well as a comparison with similar homes in the area
Home Values in the Area
Average Home Value in this Area
Purchase History
| Date | Buyer | Sale Price | Title Company |
|---|---|---|---|
| Keckeisen Bill | $75,000 | -- | |
| Us Bank Na | -- | -- | |
| Miller Jodeen | $153,000 | -- | |
| Tiedeman Anastasia | -- | -- | |
| Federal National Mortgage Association | -- | -- |
Source: Public Records
Mortgage History
| Date | Status | Borrower | Loan Amount |
|---|---|---|---|
| Previous Owner | Miller Jodeen | $30,400 | |
| Previous Owner | Miller Jodeen | $121,600 | |
| Previous Owner | Tiedeman Anastasia | $70,000 |
Source: Public Records
Tax History
| Year | Tax Paid | Tax Assessment Tax Assessment Total Assessment is a certain percentage of the fair market value that is determined by local assessors to be the total taxable value of land and additions on the property. | Land | Improvement |
|---|---|---|---|---|
| 2024 | $3,997 | $54,151 | $18,494 | $35,657 |
| 2023 | $3,811 | $48,220 | $16,468 | $31,752 |
| 2022 | $3,811 | $44,603 | $15,233 | $29,370 |
| 2021 | $3,714 | $42,556 | $14,534 | $28,022 |
| 2020 | $3,674 | $42,047 | $14,360 | $27,687 |
| 2019 | $3,698 | $40,633 | $13,877 | $26,756 |
| 2018 | $3,558 | $38,533 | $13,160 | $25,373 |
| 2017 | $3,447 | $36,500 | $12,466 | $24,034 |
| 2016 | $3,441 | $34,298 | $11,714 | $22,584 |
| 2015 | -- | $32,724 | $11,176 | $21,548 |
| 2014 | -- | $32,291 | $11,028 | $21,263 |
| 2013 | -- | $33,445 | $11,422 | $22,023 |
Source: Public Records
Map
Nearby Homes
- 909 E Railroad St
- 1117 E 5th St
- 322 N Eddy St
- 213 N Main St
- 608 Bender St
- 206 Boulevard St
- 611 N West St
- 1267 Red Fox Cir
- 422 W 3rd St
- 415 W Center St
- 1107 S Wells St
- 200 E Webb St
- Lot 2 Indian Springs Dr
- 4 Junior Dr
- Lot 4 Griswold Springs Rd
- 1102 Oak Bend Rd
- 1104 Oak Bend Rd
- 1106 Oak Bend Rd
- Bramante Ranch Plan at Fairwinds
- Hudson Plan at Fairwinds