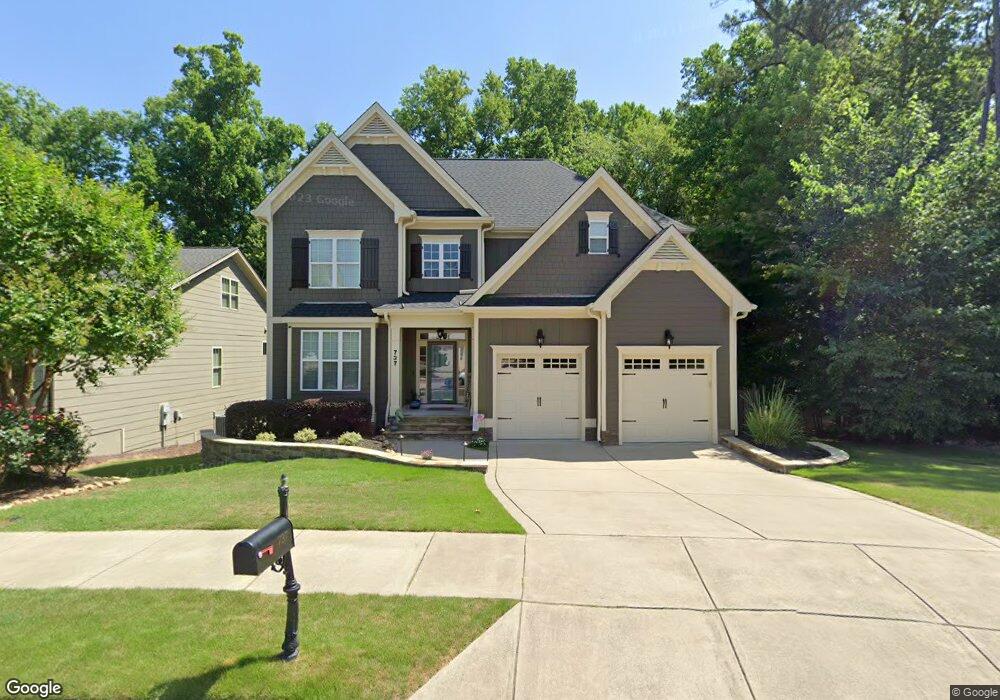
737 Minerva Dale Dr Fuquay Varina, NC 27526
Estimated Value: $530,000 - $563,000
4
Beds
3
Baths
2,875
Sq Ft
$190/Sq Ft
Est. Value
About This Home
This home is located at 737 Minerva Dale Dr, Fuquay Varina, NC 27526 and is currently estimated at $545,470, approximately $189 per square foot. 737 Minerva Dale Dr is a home located in Wake County with nearby schools including Carolina Charter Academy.
Ownership History
Date
Name
Owned For
Owner Type
Purchase Details
Closed on
Sep 17, 2013
Sold by
Wysocki Kimberly A and Estepp William M
Bought by
Grabowski Chistopher P and Grabowski Andrea M
Current Estimated Value
Home Financials for this Owner
Home Financials are based on the most recent Mortgage that was taken out on this home.
Original Mortgage
$255,550
Outstanding Balance
$190,473
Interest Rate
4.37%
Mortgage Type
New Conventional
Estimated Equity
$354,997
Purchase Details
Closed on
Oct 3, 2011
Sold by
Wysocki Stephen J
Bought by
Wysocki Kimberly A
Purchase Details
Closed on
Aug 17, 2009
Sold by
Homes By Dickerson Inc
Bought by
Wysocki Kimberly A and Wysocki Stephen J
Home Financials for this Owner
Home Financials are based on the most recent Mortgage that was taken out on this home.
Original Mortgage
$294,566
Interest Rate
5.19%
Mortgage Type
FHA
Create a Home Valuation Report for This Property
The Home Valuation Report is an in-depth analysis detailing your home's value as well as a comparison with similar homes in the area
Home Values in the Area
Average Home Value in this Area
Purchase History
| Date | Buyer | Sale Price | Title Company |
|---|---|---|---|
| Grabowski Chistopher P | $269,000 | None Available | |
| Wysocki Kimberly A | -- | None Available | |
| Wysocki Kimberly A | $300,000 | None Available |
Source: Public Records
Mortgage History
| Date | Status | Borrower | Loan Amount |
|---|---|---|---|
| Open | Grabowski Chistopher P | $255,550 | |
| Previous Owner | Wysocki Kimberly A | $294,566 |
Source: Public Records
Tax History Compared to Growth
Tax History
| Year | Tax Paid | Tax Assessment Tax Assessment Total Assessment is a certain percentage of the fair market value that is determined by local assessors to be the total taxable value of land and additions on the property. | Land | Improvement |
|---|---|---|---|---|
| 2025 | $4,279 | $486,694 | $95,000 | $391,694 |
| 2024 | $4,262 | $486,694 | $95,000 | $391,694 |
| 2023 | $3,592 | $321,250 | $52,000 | $269,250 |
| 2022 | $3,375 | $321,250 | $52,000 | $269,250 |
| 2021 | $3,216 | $321,250 | $52,000 | $269,250 |
| 2020 | $3,216 | $321,250 | $52,000 | $269,250 |
| 2019 | $3,260 | $280,921 | $55,000 | $225,921 |
| 2018 | $3,073 | $280,921 | $55,000 | $225,921 |
| 2017 | $2,963 | $280,921 | $55,000 | $225,921 |
| 2016 | $2,922 | $280,921 | $55,000 | $225,921 |
| 2015 | $2,782 | $276,307 | $54,000 | $222,307 |
| 2014 | -- | $276,307 | $54,000 | $222,307 |
Source: Public Records
Map
Nearby Homes
- 1021 Old Baron Dr
- 425 Pine Burr St
- 1103 Holland Rd
- 917 Kensley Grove Ln
- 917 Kensley Grove Ln Unit 31
- 919 Kensley Grove Ln Unit 32
- 918 Kensley Grove Ln
- 918 Kensley Grove Ln Unit 66
- Litchfield Plan at Kensley Grove
- 922 Kensley Grove Ln
- 922 Kensley Grove Ln Unit 64
- 934 Kensley Grove Ln
- 934 Kensley Grove Ln Unit 60
- 924 Kensley Grove Ln
- 924 Kensley Grove Ln Unit 63
- 928 Kensley Grove Ln Unit 61
- 804 Kensley Grove Ln Unit 9
- 806 Kensley Grove Ln Unit 8
- 747 Creekway Dr
- 516 Barneswyck Dr
- 733 Minerva Dale Dr
- 733 Minerva Dale Dr Unit 119
- 729 Minerva Dale Dr
- 729 Minerva Dale Dr Unit 118
- 736 Minerva Dale Dr
- 725 Minerva Dale Dr
- 732 Minerva Dale Dr
- 740 Minerva Dale Dr
- 728 Minerva Dale Dr
- 721 Minerva Dale Dr
- 724 Minerva Dale Dr
- 724 Minerva Dale Dr Unit lot66
- 744 Minerva Dale Dr
- 322 Pine Burr St
- 717 Minerva Dale Dr
- 720 Minerva Dale Dr
- 318 Pine Burr St
- 748 Minerva Dale Dr
- 1409 Old Regent Dr
- 326 Pine Burr St