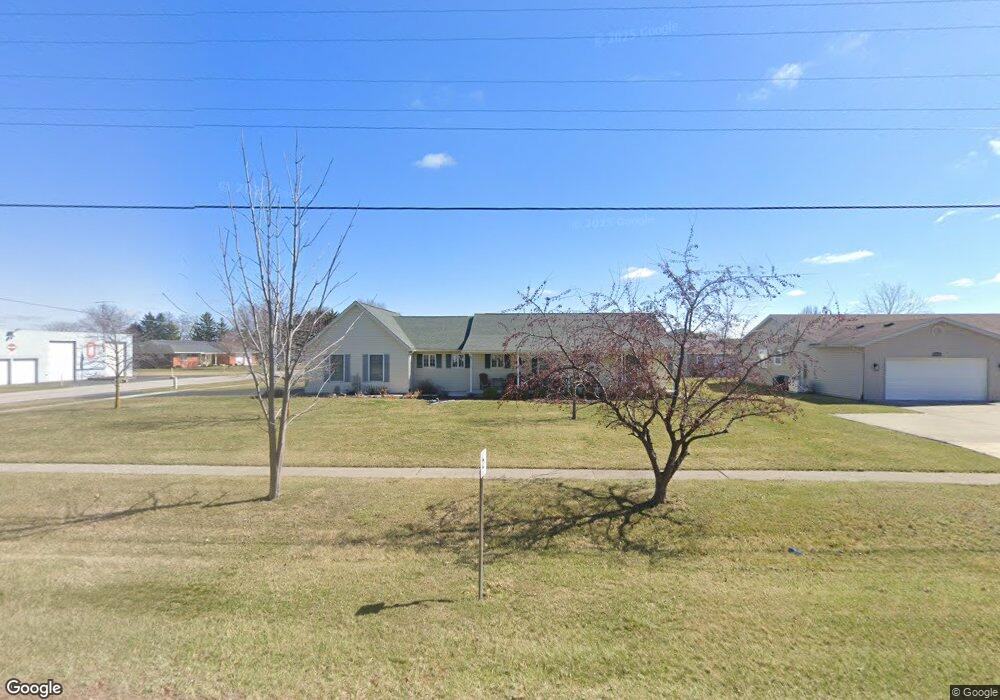
737 N Main St Arlington, OH 45814
Estimated Value: $250,000 - $290,000
3
Beds
2
Baths
1,564
Sq Ft
$170/Sq Ft
Est. Value
About This Home
This home is located at 737 N Main St, Arlington, OH 45814 and is currently estimated at $265,964, approximately $170 per square foot. 737 N Main St is a home located in Hancock County with nearby schools including Arlington Local Elementary School and Arlington Local High School.
Ownership History
Date
Name
Owned For
Owner Type
Purchase Details
Closed on
Jul 2, 2001
Sold by
Hunter Terry C
Bought by
Pore Jerry G and Pore Vickie S
Current Estimated Value
Home Financials for this Owner
Home Financials are based on the most recent Mortgage that was taken out on this home.
Original Mortgage
$100,000
Interest Rate
6.72%
Mortgage Type
New Conventional
Purchase Details
Closed on
Jun 29, 1994
Sold by
Fields Dennis
Bought by
Hunter Terry and Hunter Carol
Home Financials for this Owner
Home Financials are based on the most recent Mortgage that was taken out on this home.
Original Mortgage
$61,465
Interest Rate
8.18%
Mortgage Type
New Conventional
Purchase Details
Closed on
Feb 8, 1994
Bought by
Fields Dennis
Purchase Details
Closed on
Aug 10, 1992
Bought by
Garlock Brothers
Create a Home Valuation Report for This Property
The Home Valuation Report is an in-depth analysis detailing your home's value as well as a comparison with similar homes in the area
Purchase History
| Date | Buyer | Sale Price | Title Company |
|---|---|---|---|
| Pore Jerry G | $135,000 | -- | |
| Hunter Terry | $111,465 | -- | |
| Fields Dennis | $19,100 | -- | |
| Garlock Brothers | -- | -- |
Source: Public Records
Mortgage History
| Date | Status | Borrower | Loan Amount |
|---|---|---|---|
| Closed | Pore Jerry G | $100,000 | |
| Previous Owner | Hunter Terry | $61,465 |
Source: Public Records
Tax History
| Year | Tax Paid | Tax Assessment Tax Assessment Total Assessment is a certain percentage of the fair market value that is determined by local assessors to be the total taxable value of land and additions on the property. | Land | Improvement |
|---|---|---|---|---|
| 2024 | $3,322 | $69,540 | $12,630 | $56,910 |
| 2023 | $3,341 | $69,540 | $12,630 | $56,910 |
| 2022 | $3,356 | $69,540 | $12,630 | $56,910 |
| 2021 | $2,220 | $57,490 | $12,640 | $44,850 |
| 2020 | $2,028 | $57,490 | $12,640 | $44,850 |
| 2019 | $2,119 | $57,490 | $12,640 | $44,850 |
| 2018 | $1,871 | $50,060 | $10,990 | $39,070 |
| 2017 | $1,869 | $50,060 | $10,990 | $39,070 |
| 2016 | $1,829 | $50,060 | $10,990 | $39,070 |
| 2015 | $1,741 | $49,950 | $11,810 | $38,140 |
| 2014 | $1,675 | $49,950 | $11,810 | $38,140 |
| 2012 | $2,035 | $57,760 | $11,810 | $45,950 |
Source: Public Records
Map
Nearby Homes
- 669 N Main St
- 675 Apple Blossom Ln
- 0 Township Rd Unit 77 207219
- 0 W Main Cross St Unit 6119602
- 0 W Main Cross St Unit 6119597
- 0 W Main Cross St Unit 6119599
- 333 S Main St
- 118 Wilch St
- 0 Powell Dr Lot 3 Unit 6091840
- 13074 Township Road 152
- 9100 Township Road 25
- 207 N Main St
- 11496 County Road 45
- 18862 State Route 698
- 10260 County Road 45
- 13883 Township Road 67
- 205 S Water St
- 15878 Township Road 37
- 20453 Township Road 187
- 404 S Main St
- 733 N Main St
- 16372 County Road 24
- 12075 Fellowship Dr
- 12075 E Fellowship
- 17977 State Route 68
- 732 Apple Blossom Ln
- 729 N Main St
- 728 Apple Blossom Ln
- 725 N Main St
- 11961 Fellowship Dr
- 734 N Main St
- 819 N Main St
- 724 Apple Blossom Ln
- 721 N Main St
- 728 N Main St
- 720 Apple Blossom Ln
- 825 N Main St
- 12098 Fellowship Dr
- 721 Apple Blossom Ln Unit 721
- 725 Apple Blossom Ln
Your Personal Tour Guide
Ask me questions while you tour the home.