Estimated Value: $239,000 - $259,907
3
Beds
2
Baths
1,462
Sq Ft
$173/Sq Ft
Est. Value
About This Home
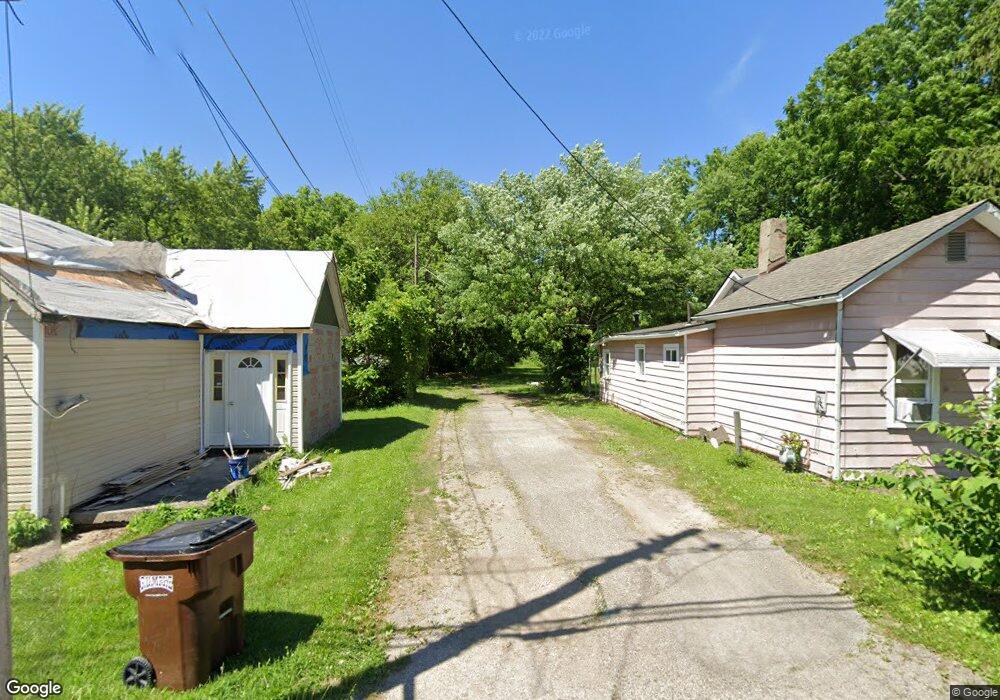
This home is located at 737 N West St, Xenia, OH 45385 and is currently estimated at $252,977, approximately $173 per square foot. 737 N West St is a home located in Greene County with nearby schools including Xenia High School, Summit Academy Community School for Alternative Learners - Xenia, and Legacy Christian Academy.
Ownership History
Date
Name
Owned For
Owner Type
Purchase Details
Closed on
Jun 10, 2005
Sold by
Spencer Rhonda
Bought by
Spencer Eric A
Current Estimated Value
Purchase Details
Closed on
Mar 27, 2003
Sold by
Farthing Edward A
Bought by
Spencer Eric A and Spencer Rhonda
Home Financials for this Owner
Home Financials are based on the most recent Mortgage that was taken out on this home.
Original Mortgage
$111,150
Outstanding Balance
$48,450
Interest Rate
5.95%
Estimated Equity
$204,527
Purchase Details
Closed on
May 16, 2000
Sold by
Estate Of Erline Farthing
Bought by
Farthing Edward A
Create a Home Valuation Report for This Property
The Home Valuation Report is an in-depth analysis detailing your home's value as well as a comparison with similar homes in the area
Home Values in the Area
Average Home Value in this Area
Purchase History
| Date | Buyer | Sale Price | Title Company |
|---|---|---|---|
| Spencer Eric A | -- | -- | |
| Spencer Eric A | $117,000 | -- | |
| Farthing Edward A | -- | -- |
Source: Public Records
Mortgage History
| Date | Status | Borrower | Loan Amount |
|---|---|---|---|
| Open | Spencer Eric A | $111,150 |
Source: Public Records
Tax History Compared to Growth
Tax History
| Year | Tax Paid | Tax Assessment Tax Assessment Total Assessment is a certain percentage of the fair market value that is determined by local assessors to be the total taxable value of land and additions on the property. | Land | Improvement |
|---|---|---|---|---|
| 2024 | $2,984 | $69,730 | $11,740 | $57,990 |
| 2023 | $2,984 | $69,730 | $11,740 | $57,990 |
| 2022 | $2,584 | $51,500 | $7,340 | $44,160 |
| 2021 | $2,618 | $51,500 | $7,340 | $44,160 |
| 2020 | $2,509 | $51,500 | $7,340 | $44,160 |
| 2019 | $2,160 | $41,740 | $7,810 | $33,930 |
| 2018 | $2,168 | $41,740 | $7,810 | $33,930 |
| 2017 | $2,304 | $41,740 | $7,810 | $33,930 |
| 2016 | $2,305 | $43,540 | $7,810 | $35,730 |
| 2015 | $2,311 | $43,540 | $7,810 | $35,730 |
| 2014 | $2,213 | $43,540 | $7,810 | $35,730 |
Source: Public Records
Map
Nearby Homes
- 613 N West St
- 659 N King St
- 878 N Detroit St
- 902 N Detroit St
- 516 N King St
- 137 Pleasant St
- 1038 Frederick Dr
- 1171 N Detroit St
- 509 Antrim Rd
- 883 Omard Dr
- 912 Omard Dr
- 119 Park Dr
- 0 W Church St
- 214 Corwin Ave
- 348 S Stadium Dr
- 479 N Stadium Dr
- 508 Marshall Dr
- 513 Redbud Ln
- 568 Louise Dr
- 343 Sheelin Rd
- 725 N West St
- 751 N West St
- 709 N West St
- 777 N West St
- 714 N West St
- 738 N Galloway St
- 732 N Galloway St
- 754 N Galloway St
- 722 N Galloway St
- 695 N West St
- 740 N West St
- 754 N West St
- 793 N West St
- 702 N Galloway St
- 768 N West St
- 776 N Galloway St
- 694 N West St
- 688 N Galloway St
- 223 W Ankeney Mill Rd
- 780 N West St