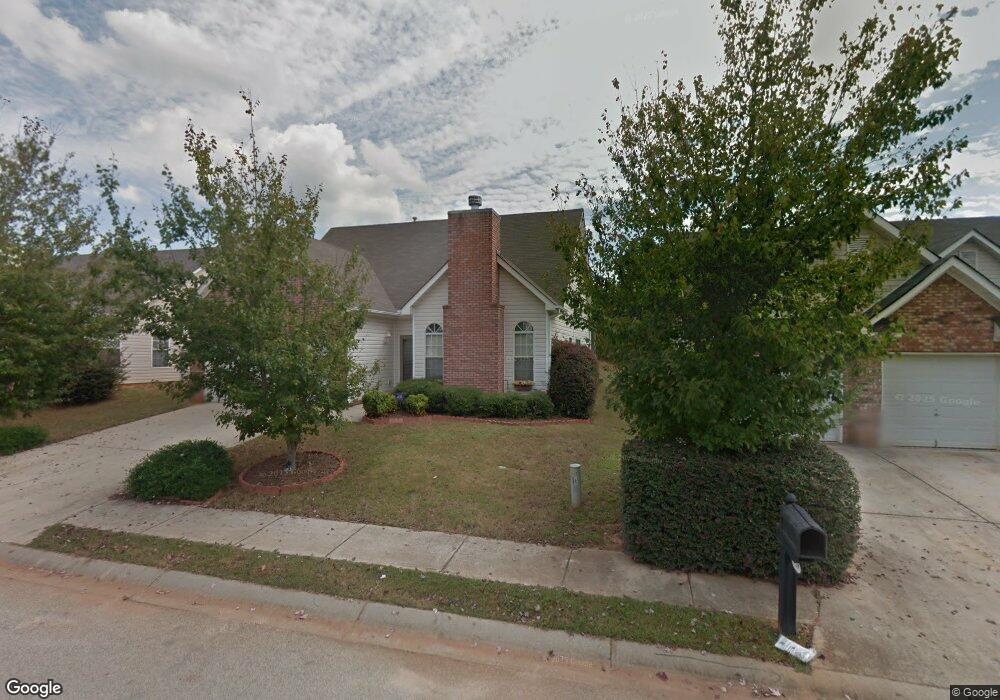
737 Patriots Point St Locust Grove, GA 30248
Estimated Value: $247,000 - $254,153
3
Beds
2
Baths
1,612
Sq Ft
$155/Sq Ft
Est. Value
About This Home
This home is located at 737 Patriots Point St, Locust Grove, GA 30248 and is currently estimated at $250,038, approximately $155 per square foot. 737 Patriots Point St is a home located in Henry County with nearby schools including Locust Grove Elementary School, Locust Grove Middle School, and Locust Grove High School.
Ownership History
Date
Name
Owned For
Owner Type
Purchase Details
Closed on
Dec 20, 2007
Sold by
Turner Stanley and Turner Kathryn
Bought by
Wilcox Jacqueline
Current Estimated Value
Home Financials for this Owner
Home Financials are based on the most recent Mortgage that was taken out on this home.
Original Mortgage
$122,400
Outstanding Balance
$77,113
Interest Rate
6.21%
Mortgage Type
New Conventional
Estimated Equity
$172,925
Purchase Details
Closed on
Aug 22, 2007
Sold by
Atkins Betty L
Bought by
Turner Stanley and Turner Kathryn
Purchase Details
Closed on
Jul 31, 2003
Sold by
John Christian Hms Inc
Bought by
Atkins Betty L
Purchase Details
Closed on
May 6, 2002
Sold by
Jcd-Lsi Llc
Bought by
John Christian Hms Inc
Home Financials for this Owner
Home Financials are based on the most recent Mortgage that was taken out on this home.
Original Mortgage
$101,175
Interest Rate
6.92%
Mortgage Type
New Conventional
Create a Home Valuation Report for This Property
The Home Valuation Report is an in-depth analysis detailing your home's value as well as a comparison with similar homes in the area
Home Values in the Area
Average Home Value in this Area
Purchase History
| Date | Buyer | Sale Price | Title Company |
|---|---|---|---|
| Wilcox Jacqueline | $122,400 | -- | |
| Turner Stanley | $98,000 | -- | |
| Atkins Betty L | $127,400 | -- | |
| John Christian Hms Inc | $25,900 | -- |
Source: Public Records
Mortgage History
| Date | Status | Borrower | Loan Amount |
|---|---|---|---|
| Open | Wilcox Jacqueline | $122,400 | |
| Previous Owner | John Christian Hms Inc | $101,175 |
Source: Public Records
Tax History Compared to Growth
Tax History
| Year | Tax Paid | Tax Assessment Tax Assessment Total Assessment is a certain percentage of the fair market value that is determined by local assessors to be the total taxable value of land and additions on the property. | Land | Improvement |
|---|---|---|---|---|
| 2025 | $3,202 | $105,640 | $16,000 | $89,640 |
| 2024 | $3,202 | $103,400 | $16,000 | $87,400 |
| 2023 | $2,517 | $108,520 | $14,000 | $94,520 |
| 2022 | $2,590 | $89,840 | $14,000 | $75,840 |
| 2021 | $2,078 | $68,080 | $14,000 | $54,080 |
| 2020 | $1,883 | $59,800 | $10,000 | $49,800 |
| 2019 | $1,785 | $54,680 | $10,000 | $44,680 |
| 2018 | $1,593 | $49,200 | $7,600 | $41,600 |
| 2016 | $1,444 | $45,200 | $8,000 | $37,200 |
| 2015 | $1,358 | $41,880 | $8,000 | $33,880 |
| 2014 | $1,159 | $36,560 | $8,000 | $28,560 |
Source: Public Records
Map
Nearby Homes
- 220 Umber Rd
- 733 Myrica Ave
- 417 Hazel Dr
- 409 Hazel Dr
- 421 Hazel Dr
- 700 Patriots Point St
- 1321 Deutz Dr
- 0 Tanger Dr
- 29 Indian Creek Rd
- 23 Club Dr
- 14 Peeksville Rd
- 279 Indian Creek Rd
- 32 Peeksville Rd
- 611 Parnassus Rd
- 508 Dolce Rd
- 656 Kimberwick Dr
- 804 Wetherford Ct
- 204 Parnassus Rd
- 652 Parnassus Rd
- 636 Parnassus Rd
- 739 Patriots Point St
- 735 Patriots Point St
- 0 Patriot's Point St Unit 7184280
- 0 Patriot's Point St Unit 7200599
- 0 Patriot's Point St
- 741 Patriots Point St
- 733 Patriots Point St
- 1029 Allegiance Dr
- 1029 Allegiance Dr Unit 114
- 1031 Allegiance Dr
- 1031 Allegiance Dr Unit 115
- 736 Patriots Point
- 1027 Allegiance Dr
- 1033 Allegiance Dr
- 1033 Allegiance Dr Unit 116
- 743 Patriots Point St
- 743 Patriot's Point St
- 1025 Allegiance Dr
- 1025 Allegiance Dr Unit 112
- 736 Patriots Point St