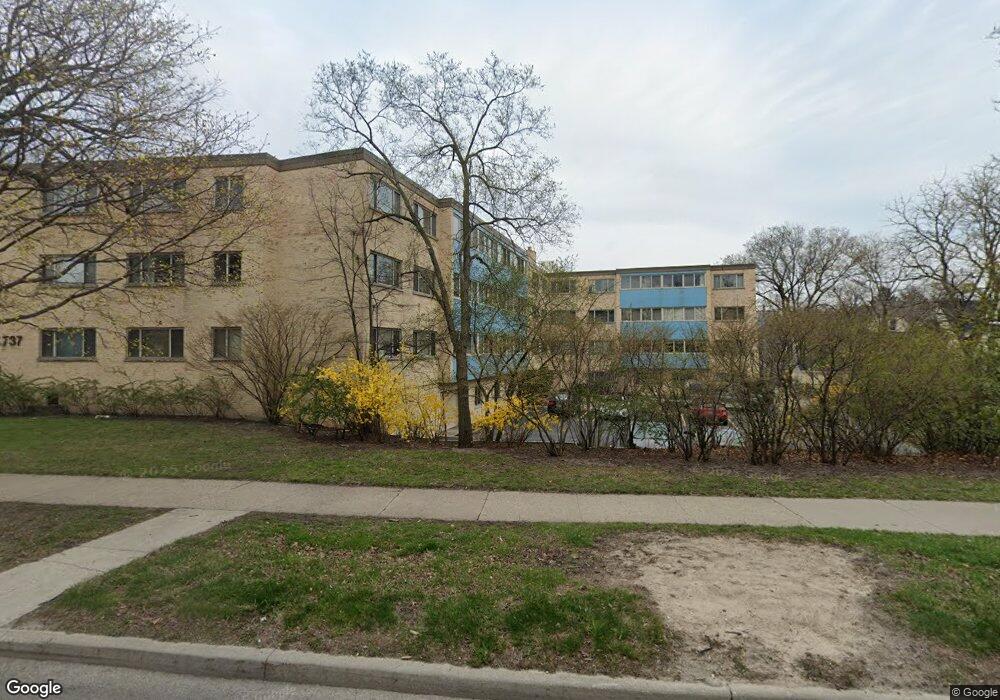
737 Ridge Ave Unit 4J Evanston, IL 60202
Estimated Value: $251,000 - $304,000
2
Beds
--
Bath
1,340
Sq Ft
$201/Sq Ft
Est. Value
About This Home
This home is located at 737 Ridge Ave Unit 4J, Evanston, IL 60202 and is currently estimated at $269,474, approximately $201 per square foot. 737 Ridge Ave Unit 4J is a home located in Cook County with nearby schools including Oakton Elementary School, Chute Middle School, and Evanston Township High School.
Ownership History
Date
Name
Owned For
Owner Type
Purchase Details
Closed on
Jun 15, 2005
Sold by
Sabic Igor and Sabic Natasa
Bought by
Fischer Steven P
Current Estimated Value
Home Financials for this Owner
Home Financials are based on the most recent Mortgage that was taken out on this home.
Original Mortgage
$176,000
Outstanding Balance
$87,349
Interest Rate
5%
Mortgage Type
New Conventional
Estimated Equity
$182,125
Purchase Details
Closed on
Dec 29, 2000
Sold by
Summer Joel S and Summer Jack D
Bought by
Sabic Igor and Sabic Natasa
Home Financials for this Owner
Home Financials are based on the most recent Mortgage that was taken out on this home.
Original Mortgage
$121,500
Interest Rate
7.69%
Purchase Details
Closed on
Dec 18, 1998
Sold by
Summer Cecile Z
Bought by
Summer Cecil Z and Cecile Z Summer Trust
Create a Home Valuation Report for This Property
The Home Valuation Report is an in-depth analysis detailing your home's value as well as a comparison with similar homes in the area
Home Values in the Area
Average Home Value in this Area
Purchase History
| Date | Buyer | Sale Price | Title Company |
|---|---|---|---|
| Fischer Steven P | $220,000 | Lawyers | |
| Sabic Igor | $135,000 | -- | |
| Summer Cecil Z | -- | -- |
Source: Public Records
Mortgage History
| Date | Status | Borrower | Loan Amount |
|---|---|---|---|
| Open | Fischer Steven P | $176,000 | |
| Previous Owner | Sabic Igor | $121,500 |
Source: Public Records
Tax History Compared to Growth
Tax History
| Year | Tax Paid | Tax Assessment Tax Assessment Total Assessment is a certain percentage of the fair market value that is determined by local assessors to be the total taxable value of land and additions on the property. | Land | Improvement |
|---|---|---|---|---|
| 2024 | $4,014 | $19,680 | $2,363 | $17,317 |
| 2023 | $3,826 | $19,680 | $2,363 | $17,317 |
| 2022 | $3,826 | $19,680 | $2,363 | $17,317 |
| 2021 | $3,628 | $16,818 | $1,374 | $15,444 |
| 2020 | $3,639 | $16,818 | $1,374 | $15,444 |
| 2019 | $3,574 | $18,485 | $1,374 | $17,111 |
| 2018 | $2,930 | $13,990 | $1,159 | $12,831 |
| 2017 | $2,869 | $13,990 | $1,159 | $12,831 |
| 2016 | $2,946 | $13,990 | $1,159 | $12,831 |
| 2015 | $3,732 | $16,345 | $966 | $15,379 |
| 2014 | $3,711 | $16,345 | $966 | $15,379 |
| 2013 | $3,609 | $16,345 | $966 | $15,379 |
Source: Public Records
Map
Nearby Homes
- 929 Washington St Unit 404
- 828 Monroe St
- 835 Ridge Ave Unit 207
- 835 Ridge Ave Unit 507
- 836 Elmwood Ave Unit 2
- SAN JUAN GRANDE La Cascabela
- 1114 Main St Unit 1W
- 647 Asbury Ave
- 553 Barton Ave
- 820 Seward St Unit 2D
- 1021 South Blvd
- 714 Seward St
- 811 Chicago Ave Unit 308
- 900 Chicago Ave Unit 413
- 900 Chicago Ave Unit 416
- 1022 Elmwood Ave
- 828 Oakton St Unit 3F
- 828 Oakton St Unit 4F
- 828 Oakton St Unit 5F
- 1408 Seward St
- 737 Ridge Ave Unit 2D
- 737 Ridge Ave Unit 3F
- 737 Ridge Ave Unit 4H
- 737 Ridge Ave Unit 4G
- 737 Ridge Ave Unit 3D
- 737 Ridge Ave Unit 1K
- 737 Ridge Ave Unit 1H
- 737 Ridge Ave Unit 1L
- 737 Ridge Ave Unit 2C
- 737 Ridge Ave Unit 4F
- 737 Ridge Ave Unit 4B
- 737 Ridge Ave Unit 4D
- 737 Ridge Ave Unit 1J
- 737 Ridge Ave Unit 3A
- 737 Ridge Ave Unit 3H
- 737 Ridge Ave Unit 3B
- 737 Ridge Ave Unit 2J
- 737 Ridge Ave Unit 4A
- 737 Ridge Ave Unit 2G
- 737 Ridge Ave Unit 3E