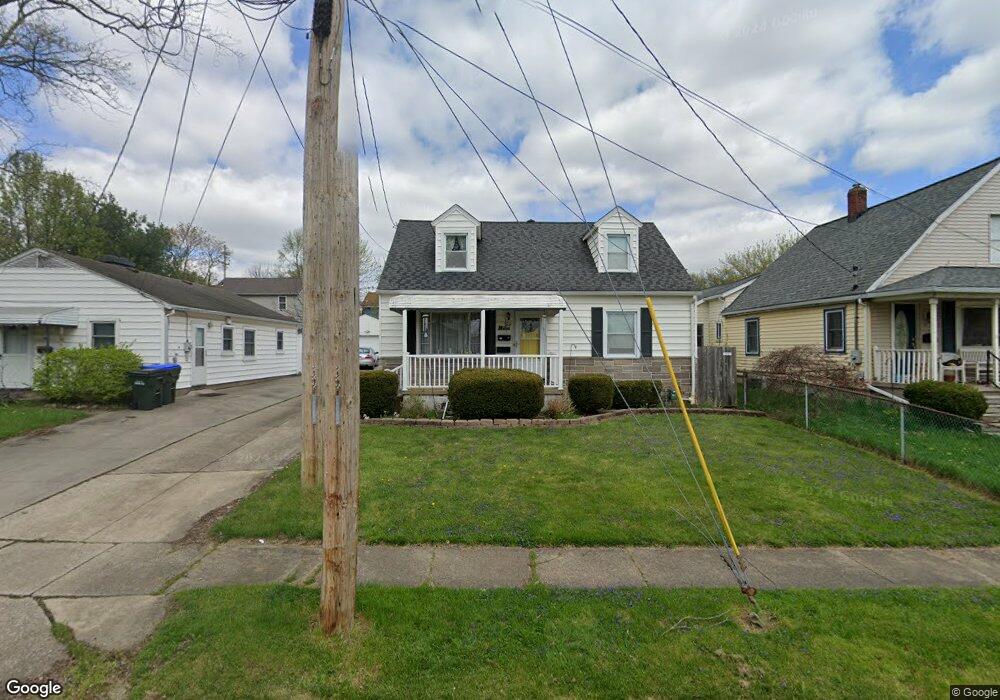
737 Rudolph Ave Cuyahoga Falls, OH 44221
Mud Brook NeighborhoodEstimated Value: $181,000 - $217,000
3
Beds
2
Baths
1,165
Sq Ft
$168/Sq Ft
Est. Value
About This Home
This home is located at 737 Rudolph Ave, Cuyahoga Falls, OH 44221 and is currently estimated at $195,563, approximately $167 per square foot. 737 Rudolph Ave is a home located in Summit County with nearby schools including Lincoln Elementary School, Roberts Middle School, and Cuyahoga Falls High School.
Ownership History
Date
Name
Owned For
Owner Type
Purchase Details
Closed on
Aug 19, 2011
Sold by
Gates Justin J and Gates Carrie A
Bought by
Johnson Toni Marie
Current Estimated Value
Home Financials for this Owner
Home Financials are based on the most recent Mortgage that was taken out on this home.
Original Mortgage
$107,211
Outstanding Balance
$74,473
Interest Rate
4.64%
Mortgage Type
Future Advance Clause Open End Mortgage
Estimated Equity
$121,090
Purchase Details
Closed on
Aug 7, 2007
Sold by
Gates Justin and Gates Carrie
Bought by
Gates Justin J and Gates Carrie A
Purchase Details
Closed on
Nov 23, 2002
Sold by
Bertoldi Emelio J and Bertoldi Theda
Bought by
Gates Justin and Gates Carrie
Home Financials for this Owner
Home Financials are based on the most recent Mortgage that was taken out on this home.
Original Mortgage
$82,400
Interest Rate
6.08%
Create a Home Valuation Report for This Property
The Home Valuation Report is an in-depth analysis detailing your home's value as well as a comparison with similar homes in the area
Home Values in the Area
Average Home Value in this Area
Purchase History
| Date | Buyer | Sale Price | Title Company |
|---|---|---|---|
| Johnson Toni Marie | $110,000 | Chicago Title Insurance Co | |
| Gates Justin J | -- | Attorney | |
| Gates Justin | $103,000 | Real Living Title Agency Ltd |
Source: Public Records
Mortgage History
| Date | Status | Borrower | Loan Amount |
|---|---|---|---|
| Open | Johnson Toni Marie | $107,211 | |
| Previous Owner | Gates Justin | $82,400 | |
| Closed | Gates Justin | $20,000 |
Source: Public Records
Tax History Compared to Growth
Tax History
| Year | Tax Paid | Tax Assessment Tax Assessment Total Assessment is a certain percentage of the fair market value that is determined by local assessors to be the total taxable value of land and additions on the property. | Land | Improvement |
|---|---|---|---|---|
| 2025 | $2,613 | $48,402 | $10,077 | $38,325 |
| 2024 | $2,613 | $48,402 | $10,077 | $38,325 |
| 2023 | $2,613 | $48,402 | $10,077 | $38,325 |
| 2022 | $2,549 | $38,350 | $7,872 | $30,478 |
| 2021 | $2,549 | $38,350 | $7,872 | $30,478 |
| 2020 | $2,507 | $38,350 | $7,870 | $30,480 |
| 2019 | $2,779 | $38,710 | $7,870 | $30,840 |
| 2018 | $2,359 | $38,710 | $7,870 | $30,840 |
| 2017 | $2,153 | $38,710 | $7,870 | $30,840 |
| 2016 | $2,155 | $35,800 | $7,870 | $27,930 |
| 2015 | $2,153 | $35,800 | $7,870 | $27,930 |
| 2014 | $2,154 | $35,800 | $7,870 | $27,930 |
| 2013 | $2,061 | $34,540 | $7,870 | $26,670 |
Source: Public Records
Map
Nearby Homes
- 455 Marguerite Ave
- 419 Keenan Ave
- 2886 Norwood St
- 2834 Norwood St
- 2869 Lakewood Dr
- 2870 Kent Rd
- Riverton Plan at Miller's Landing
- Hilltop Plan at Miller's Landing
- Amberwood Plan at Miller's Landing
- Willwood Plan at Miller's Landing
- Woodside Plan at Miller's Landing
- Westchester Plan at Miller's Landing
- Greenfield Plan at Miller's Landing
- 435 Roanoke Ave
- 2762 Bailey Rd
- 2890 Bailey Rd
- 306 Hollywood Ave
- 54 Washington Ave
- 3320 Hudson Dr
- 2693 Northland St
- 743 Rudolph Ave
- 731 Rudolph Ave
- 725 Rudolph Ave
- 736 Nutwood Ave
- 742 Nutwood Ave
- 719 Rudolph Ave
- 748 Nutwood Ave
- 726 Nutwood Ave
- 730 Nutwood Ave
- 736 Rudolph Ave
- 713 Rudolph Ave
- 718 Nutwood Ave
- 716 Rudolph Ave
- 724 Rudolph Ave
- 707 Rudolph Ave
- 712 Nutwood Ave
- 714 Rudolph Ave Unit 716
- 701 Rudolph Ave
- 708 Rudolph Ave
- 700 Rudolph Ave