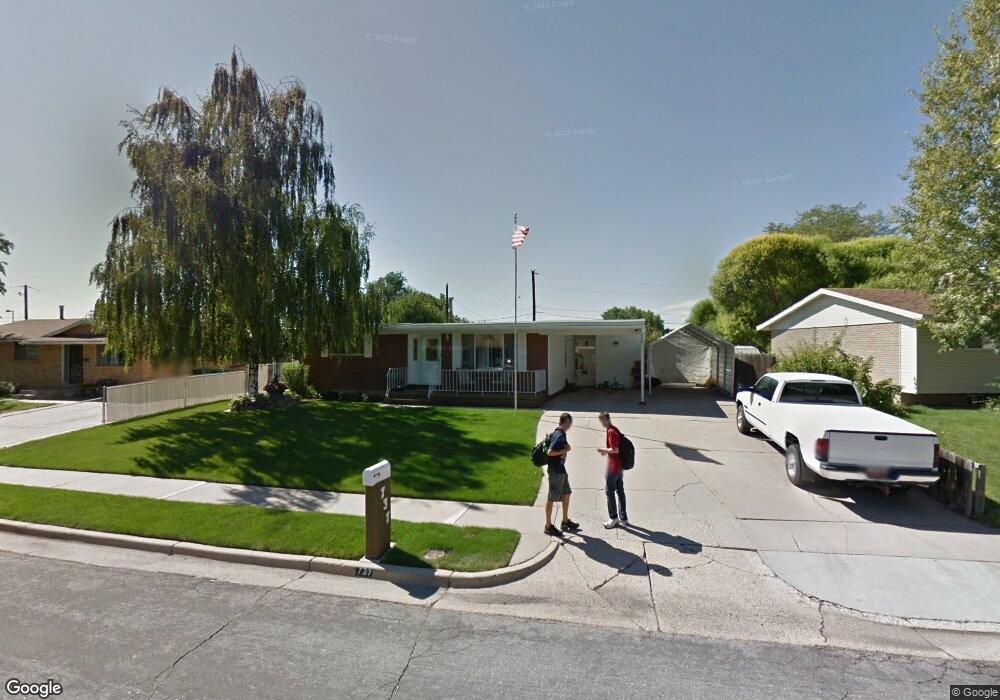
737 Sapphire Dr Layton, UT 84041
Estimated Value: $391,000 - $429,000
3
Beds
2
Baths
1,007
Sq Ft
$404/Sq Ft
Est. Value
About This Home
This home is located at 737 Sapphire Dr, Layton, UT 84041 and is currently estimated at $407,230, approximately $404 per square foot. 737 Sapphire Dr is a home located in Davis County with nearby schools including Crestview Elementary School, Central Davis Junior High School, and Layton High School.
Ownership History
Date
Name
Owned For
Owner Type
Purchase Details
Closed on
Feb 26, 2021
Sold by
Williams Helen Kay
Bought by
Helen K Williams Family Revocable Living and Kauffman
Current Estimated Value
Home Financials for this Owner
Home Financials are based on the most recent Mortgage that was taken out on this home.
Original Mortgage
$247,500
Outstanding Balance
$221,362
Interest Rate
2.7%
Mortgage Type
New Conventional
Estimated Equity
$185,868
Purchase Details
Closed on
Feb 25, 2021
Sold by
Mounter Kurt
Bought by
Mounteer Kurt and Mounteer Cheryle E
Home Financials for this Owner
Home Financials are based on the most recent Mortgage that was taken out on this home.
Original Mortgage
$247,500
Outstanding Balance
$221,362
Interest Rate
2.7%
Mortgage Type
New Conventional
Estimated Equity
$185,868
Purchase Details
Closed on
Jan 31, 2020
Sold by
Williams Helen K
Bought by
Williams Helen K and Helen K Willliams Family Rlt
Create a Home Valuation Report for This Property
The Home Valuation Report is an in-depth analysis detailing your home's value as well as a comparison with similar homes in the area
Home Values in the Area
Average Home Value in this Area
Purchase History
| Date | Buyer | Sale Price | Title Company |
|---|---|---|---|
| Helen K Williams Family Revocable Living | -- | -- | |
| Mounteer Kurt | -- | Accommodation | |
| Mounteer Kurt | -- | First American Title | |
| Williams Helen K | -- | First American Titl |
Source: Public Records
Mortgage History
| Date | Status | Borrower | Loan Amount |
|---|---|---|---|
| Open | Mounteer Kurt | $247,500 |
Source: Public Records
Tax History
| Year | Tax Paid | Tax Assessment Tax Assessment Total Assessment is a certain percentage of the fair market value that is determined by local assessors to be the total taxable value of land and additions on the property. | Land | Improvement |
|---|---|---|---|---|
| 2025 | $1,975 | $207,350 | $101,837 | $105,513 |
| 2024 | $1,893 | $200,199 | $118,671 | $81,528 |
| 2023 | $1,771 | $181,500 | $77,649 | $103,850 |
| 2022 | $1,858 | $342,000 | $135,665 | $206,335 |
| 2021 | $1,716 | $259,000 | $104,587 | $154,413 |
| 2020 | $1,554 | $225,000 | $88,035 | $136,965 |
| 2019 | $1,544 | $219,000 | $83,643 | $135,357 |
| 2018 | $1,377 | $196,000 | $83,643 | $112,357 |
| 2016 | $1,164 | $85,525 | $26,701 | $58,824 |
| 2015 | $1,095 | $76,340 | $26,701 | $49,639 |
| 2014 | $940 | $75,257 | $26,701 | $48,556 |
| 2013 | -- | $77,505 | $18,612 | $58,893 |
Source: Public Records
Map
Nearby Homes
Your Personal Tour Guide
Ask me questions while you tour the home.