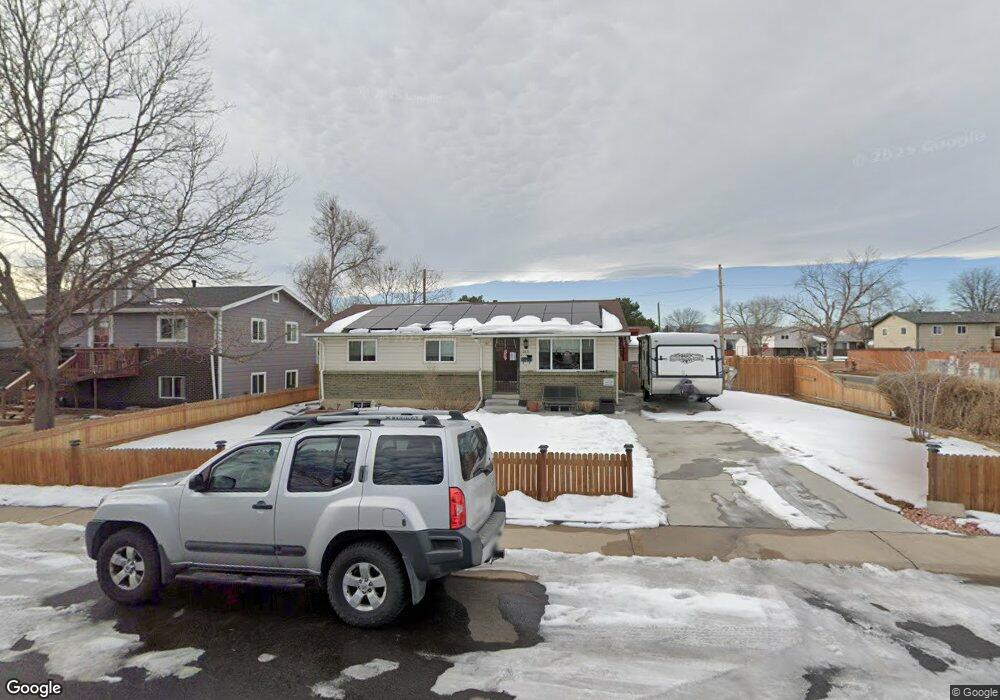
7371 Vrain St Westminster, CO 80030
Southeast Westminster NeighborhoodEstimated Value: $432,000 - $451,126
3
Beds
1
Bath
925
Sq Ft
$477/Sq Ft
Est. Value
About This Home
This home is located at 7371 Vrain St, Westminster, CO 80030 and is currently estimated at $441,532, approximately $477 per square foot. 7371 Vrain St is a home located in Adams County with nearby schools including Tennyson Knolls Preparatory School, Shaw Heights Middle School, and Westminster High School.
Ownership History
Date
Name
Owned For
Owner Type
Purchase Details
Closed on
May 10, 2013
Sold by
Lor Tasha D
Bought by
Lor Tasha D and Lor Kha
Current Estimated Value
Home Financials for this Owner
Home Financials are based on the most recent Mortgage that was taken out on this home.
Original Mortgage
$144,016
Outstanding Balance
$100,990
Interest Rate
3.25%
Mortgage Type
FHA
Estimated Equity
$340,542
Purchase Details
Closed on
Feb 23, 2007
Sold by
Lor Kha and Lor Xiage
Bought by
Bolejack Tasha and Lor Kha
Purchase Details
Closed on
Aug 28, 1996
Sold by
Coberly Michael C and Coberly Pamala J
Bought by
Lor Kha and Lor Xiage
Home Financials for this Owner
Home Financials are based on the most recent Mortgage that was taken out on this home.
Original Mortgage
$104,000
Interest Rate
8.27%
Create a Home Valuation Report for This Property
The Home Valuation Report is an in-depth analysis detailing your home's value as well as a comparison with similar homes in the area
Home Values in the Area
Average Home Value in this Area
Purchase History
| Date | Buyer | Sale Price | Title Company |
|---|---|---|---|
| Lor Tasha D | -- | None Available | |
| Lor Tasha D | -- | None Available | |
| Bolejack Tasha | -- | None Available | |
| Lor Kha | $110,000 | -- |
Source: Public Records
Mortgage History
| Date | Status | Borrower | Loan Amount |
|---|---|---|---|
| Open | Lor Tasha D | $144,016 | |
| Closed | Lor Kha | $104,000 |
Source: Public Records
Tax History Compared to Growth
Tax History
| Year | Tax Paid | Tax Assessment Tax Assessment Total Assessment is a certain percentage of the fair market value that is determined by local assessors to be the total taxable value of land and additions on the property. | Land | Improvement |
|---|---|---|---|---|
| 2024 | $2,490 | $25,880 | $5,380 | $20,500 |
| 2023 | $2,470 | $29,700 | $5,140 | $24,560 |
| 2022 | $2,415 | $23,790 | $5,280 | $18,510 |
| 2021 | $2,487 | $23,790 | $5,280 | $18,510 |
| 2020 | $2,332 | $22,680 | $5,430 | $17,250 |
| 2019 | $2,328 | $22,680 | $5,430 | $17,250 |
| 2018 | $1,775 | $17,190 | $5,760 | $11,430 |
| 2017 | $1,513 | $17,190 | $5,760 | $11,430 |
| 2016 | $1,216 | $12,990 | $2,630 | $10,360 |
| 2015 | $1,214 | $12,990 | $2,630 | $10,360 |
| 2014 | $1,068 | $11,050 | $2,230 | $8,820 |
Source: Public Records
Map
Nearby Homes
- 7377 Tennyson St
- 7360 Tennyson St
- 4910 W 73rd Ave
- 5035 W 73rd Ave
- 5123 W 73rd Ave Unit 5123
- 7123 Winona Ct
- 7561 Zenobia St
- 7348 Bradburn Blvd
- 7132 Xavier Way
- 7074 Yates St
- 7414 Benton St
- 7051 Zenobia St
- 7373 Ames Ct
- 5461 W 73rd Ave
- 5321 W 76th Ave Unit 307
- 5321 W 76th Ave Unit 322
- 7354 Benton St
- 7586 Chase St
- 5443 W 76th Ave Unit 404
- 5443 W 76th Ave Unit 422