Estimated Value: $85,000 - $131,000
2
Beds
1
Bath
1,090
Sq Ft
$97/Sq Ft
Est. Value
About This Home
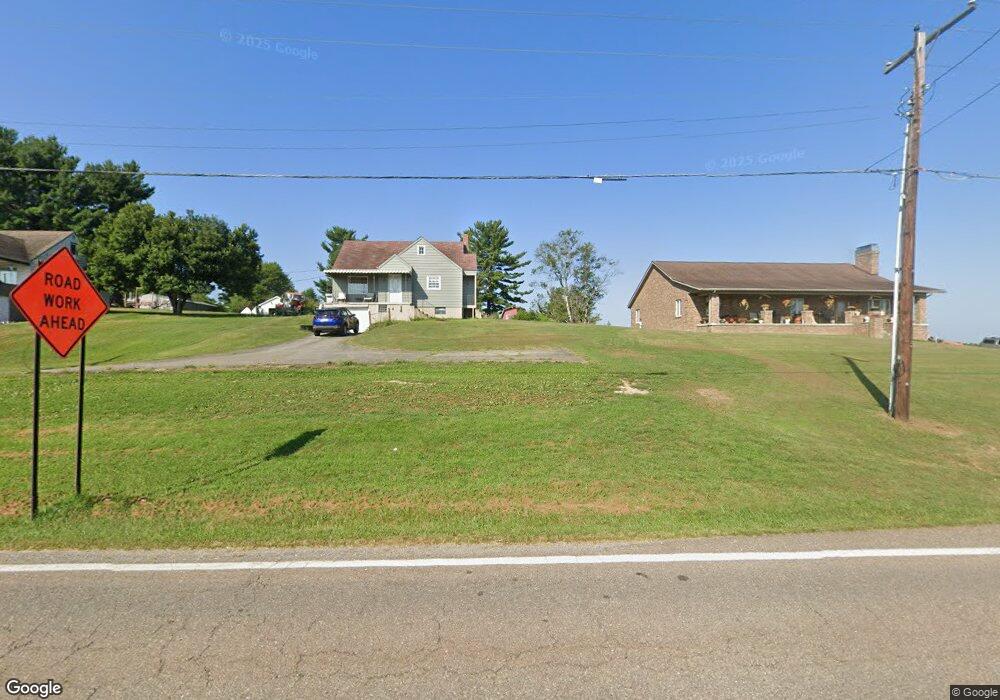
This home is located at 73720 Pleasant View Dr, Adena, OH 43901 and is currently estimated at $105,982, approximately $97 per square foot. 73720 Pleasant View Dr is a home located in Belmont County with nearby schools including Anna Marie Ayers Elementary School, Martins Ferry Middle School, and Martins Ferry High School.
Ownership History
Date
Name
Owned For
Owner Type
Purchase Details
Closed on
Mar 30, 2017
Sold by
Estate Of Elsie June Ciechomski
Bought by
Timko Marlene C and Sawchuk Sherry L
Current Estimated Value
Home Financials for this Owner
Home Financials are based on the most recent Mortgage that was taken out on this home.
Original Mortgage
$55,000
Interest Rate
4.23%
Mortgage Type
Commercial
Purchase Details
Closed on
Feb 7, 2017
Sold by
Timko Marlene C and Timko Matthew C
Bought by
Brown Timothy Scott and Brown Marianne
Home Financials for this Owner
Home Financials are based on the most recent Mortgage that was taken out on this home.
Original Mortgage
$55,000
Interest Rate
4.23%
Mortgage Type
Commercial
Purchase Details
Closed on
Aug 11, 1995
Sold by
Ciechomski Elsie
Bought by
Ciechomski Elsie
Purchase Details
Closed on
Jan 1, 1986
Sold by
Ciechomski Henry and Ciechomski Elsie
Bought by
Ciechomski Henry and Ciechomski Elsie
Create a Home Valuation Report for This Property
The Home Valuation Report is an in-depth analysis detailing your home's value as well as a comparison with similar homes in the area
Purchase History
| Date | Buyer | Sale Price | Title Company |
|---|---|---|---|
| Timko Marlene C | -- | Attorney | |
| Brown Timothy Scott | $55,000 | Attorney | |
| Ciechomski Elsie | -- | -- | |
| Ciechomski Henry | -- | -- |
Source: Public Records
Mortgage History
| Date | Status | Borrower | Loan Amount |
|---|---|---|---|
| Previous Owner | Brown Timothy Scott | $55,000 |
Source: Public Records
Tax History
| Year | Tax Paid | Tax Assessment Tax Assessment Total Assessment is a certain percentage of the fair market value that is determined by local assessors to be the total taxable value of land and additions on the property. | Land | Improvement |
|---|---|---|---|---|
| 2025 | $1,082 | $29,170 | $7,200 | $21,970 |
| 2024 | $1,067 | $29,170 | $7,200 | $21,970 |
| 2023 | $1,119 | $28,680 | $7,200 | $21,480 |
| 2022 | $1,119 | $28,676 | $7,196 | $21,480 |
| 2021 | $1,113 | $28,675 | $7,192 | $21,483 |
| 2020 | $1,029 | $24,930 | $6,250 | $18,680 |
| 2019 | $1,032 | $24,930 | $6,250 | $18,680 |
| 2018 | $951 | $24,930 | $6,250 | $18,680 |
| 2017 | $853 | $19,630 | $5,020 | $14,610 |
| 2016 | $840 | $19,630 | $5,020 | $14,610 |
| 2015 | $846 | $19,630 | $5,020 | $14,610 |
| 2014 | $815 | $19,780 | $4,560 | $15,220 |
| 2013 | $780 | $19,780 | $4,560 | $15,220 |
Source: Public Records
Map
Nearby Homes
- 1749 Us 250
- 0 Terra Ridge Ln
- 72117 Barton Rd
- 71480 Mercer Rd
- 71421 Center St
- 71720 Pike St
- 49408 State Route 250
- 71600 Hall St
- 71347 Hall St
- 71900 Cope St
- 1281 Township Road 129
- 269 Union St
- 49497 Great Lakes Rd
- 49851 Main St
- 9 Township Rd
- 52125 Center St
- 52140 Home St
- 70392 Barton Rd
- 71571 Main St
- 153 County Road 3
- 73810 Pleasant Grove Rd
- 0 St Rt 250 Unit T9507116
- 250 St Rt 250
- 71771 St Rt 250
- 0 St Rt 250 Unit 3750408
- 72939 Us 250
- 73704 Pleasant View Dr
- 73799 Pleasant Grove Rd
- 73680 Pleasant View Dr
- 73811 Pleasant Grove Rd
- 73668 Pleasant View Dr
- 73761 Pleasant Grove Rd
- 73642 Pleasant View Dr
- 73741 Pleasant Grove Rd
- 73620 Pleasant View Dr
- 73710 Pleasant Grove Rd
- 73861 Pleasant Grove Rd
- 73700 Pleasant Grove Rd
- 73668 Pleasant Grove Rd
- 73670 Pleasant Grove Rd
Your Personal Tour Guide
Ask me questions while you tour the home.