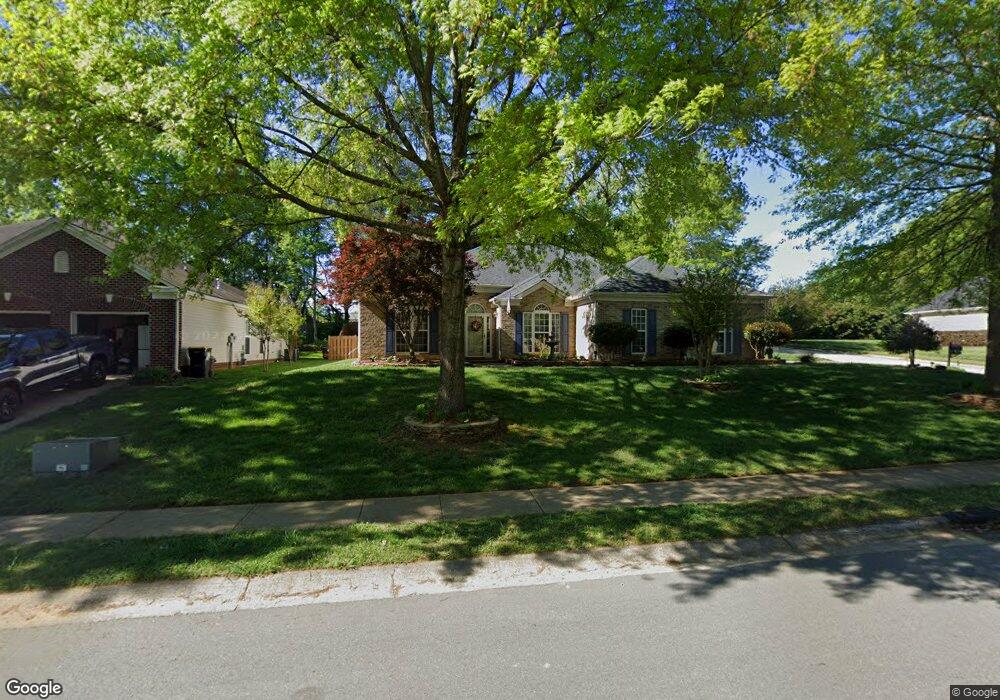
7373 Sedgebrook Dr W Stanley, NC 28164
Estimated Value: $459,000 - $503,000
3
Beds
2
Baths
2,162
Sq Ft
$221/Sq Ft
Est. Value
About This Home
This home is located at 7373 Sedgebrook Dr W, Stanley, NC 28164 and is currently estimated at $478,036, approximately $221 per square foot. 7373 Sedgebrook Dr W is a home located in Lincoln County with nearby schools including Catawba Springs Elementary School, East Lincoln Middle School, and East Lincoln High School.
Ownership History
Date
Name
Owned For
Owner Type
Purchase Details
Closed on
Dec 30, 2009
Sold by
Scott Michael C and Scott Pamela N
Bought by
Wojtowicz William A and Wojtowicz Nancy L
Current Estimated Value
Home Financials for this Owner
Home Financials are based on the most recent Mortgage that was taken out on this home.
Original Mortgage
$100,000
Outstanding Balance
$64,159
Interest Rate
4.82%
Mortgage Type
New Conventional
Estimated Equity
$413,877
Purchase Details
Closed on
Jul 6, 2006
Sold by
Kiser Lee S and Kiser Shelley R
Bought by
Scott Michael C and Scott Pamela N
Home Financials for this Owner
Home Financials are based on the most recent Mortgage that was taken out on this home.
Original Mortgage
$226,213
Interest Rate
6.54%
Mortgage Type
VA
Purchase Details
Closed on
Jun 2, 2003
Bought by
Kiser Lee S
Purchase Details
Closed on
May 9, 2002
Bought by
Niblock Development Corp
Create a Home Valuation Report for This Property
The Home Valuation Report is an in-depth analysis detailing your home's value as well as a comparison with similar homes in the area
Home Values in the Area
Average Home Value in this Area
Purchase History
| Date | Buyer | Sale Price | Title Company |
|---|---|---|---|
| Wojtowicz William A | $222,000 | None Available | |
| Scott Michael C | $242,500 | None Available | |
| Kiser Lee S | $201,000 | -- | |
| Niblock Development Corp | $90,500 | -- |
Source: Public Records
Mortgage History
| Date | Status | Borrower | Loan Amount |
|---|---|---|---|
| Open | Wojtowicz William A | $100,000 | |
| Previous Owner | Scott Michael C | $226,213 |
Source: Public Records
Tax History
| Year | Tax Paid | Tax Assessment Tax Assessment Total Assessment is a certain percentage of the fair market value that is determined by local assessors to be the total taxable value of land and additions on the property. | Land | Improvement |
|---|---|---|---|---|
| 2025 | $2,836 | $446,381 | $82,000 | $364,381 |
| 2024 | $2,805 | $446,381 | $82,000 | $364,381 |
| 2023 | $2,800 | $446,381 | $82,000 | $364,381 |
| 2022 | $2,063 | $263,633 | $52,000 | $211,633 |
| 2021 | $2,076 | $263,633 | $52,000 | $211,633 |
| 2020 | $1,838 | $263,633 | $52,000 | $211,633 |
| 2019 | $1,838 | $263,633 | $52,000 | $211,633 |
| 2018 | $1,635 | $219,074 | $46,500 | $172,574 |
| 2017 | $1,534 | $219,074 | $46,500 | $172,574 |
| 2016 | $1,527 | $219,074 | $46,500 | $172,574 |
| 2015 | $1,650 | $219,074 | $46,500 | $172,574 |
| 2014 | $1,459 | $200,648 | $46,500 | $154,148 |
Source: Public Records
Map
Nearby Homes
- 7411 Gate Key Ct
- 7526 Sedgebrook Dr E
- 7638 Sedgebrook Dr E
- 7479 Bluff Point Ln Unit 13
- 1251 Carrington Dr
- 1259 Carrington Dr
- 1268 Carrington Dr
- 7709 Sedgebrook Dr E
- 7695 Sedgebrook Dr E
- 7531 Pilot Cove Ct
- 7157 Sedgebrook Dr W
- 7125 Sedgebrook Dr W
- 7039 Sedgebrook Dr W
- 7466 Mountain Ridge Dr
- 274/294 N Pilot Knob Rd
- 963 Brookdale Ln
- 7663 Woodcrest Dr
- 7508 Turkey Trot Dr
- 7738 Burning Ridge Dr
- 7778 Burning Ridge Dr
- 7369 Sedgebrook Dr W
- 7387 Sedgebrook Dr W
- 7357 Sedgebrook Dr W
- 7376 Sedgebrook Dr W
- 7428 Easy Trail
- 7372 Sedgebrook Dr W
- 614 Avenel Ln
- 7355 Sedgebrook Dr W
- 7388 Sedgebrook Dr W
- 7364 Sedgebrook Dr W
- 7397 Sedgebrook Dr W
- 7397 Sedgebrook Dr W Unit 144
- 7356 Sedgebrook Dr W
- 7344 Sedgebrook Dr W
- 7339 Sedgebrook Dr W
- 7470 Brentfield Dr
- 7466 Brentfield Dr
- 7340 Sedgebrook Dr W
- 7474 Brentfield Dr
- 7422 Sedgebrook Dr W
Your Personal Tour Guide
Ask me questions while you tour the home.