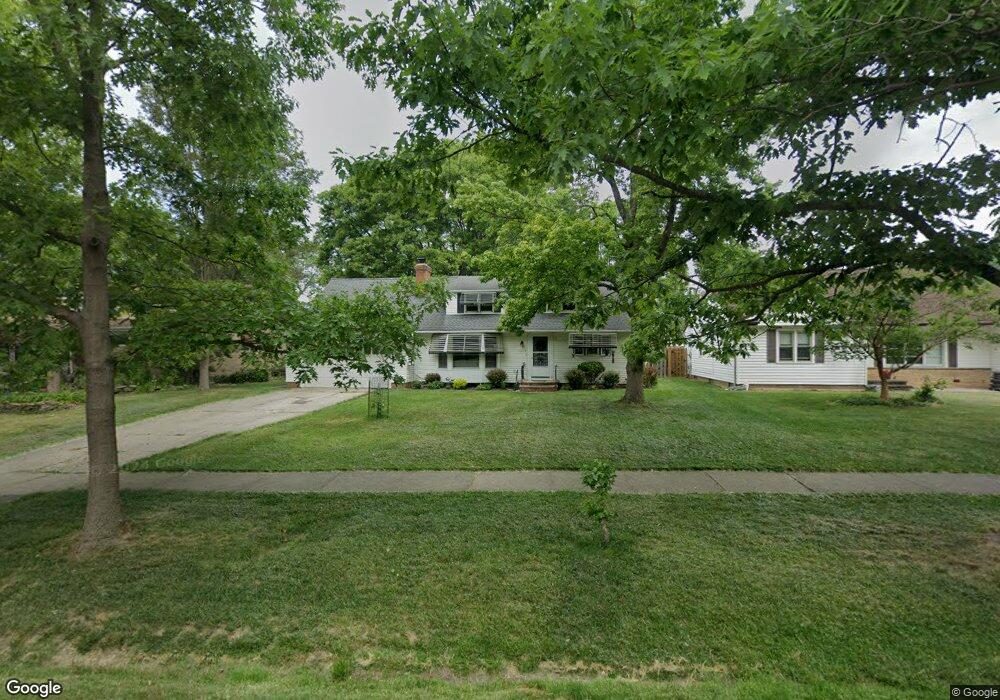
7374 Big Creek Pkwy Middleburg Heights, OH 44130
Estimated Value: $226,000 - $276,000
4
Beds
1
Bath
1,598
Sq Ft
$162/Sq Ft
Est. Value
About This Home
This home is located at 7374 Big Creek Pkwy, Middleburg Heights, OH 44130 and is currently estimated at $259,286, approximately $162 per square foot. 7374 Big Creek Pkwy is a home with nearby schools including Big Creek Elementary School, Berea-Midpark Middle School, and Berea-Midpark High School.
Ownership History
Date
Name
Owned For
Owner Type
Purchase Details
Closed on
May 25, 2000
Sold by
Ijaz Jonathan Javaid and Scott Gene Marie
Bought by
Scott Mary Ellen
Current Estimated Value
Home Financials for this Owner
Home Financials are based on the most recent Mortgage that was taken out on this home.
Original Mortgage
$113,590
Interest Rate
8.14%
Purchase Details
Closed on
May 5, 2000
Sold by
Estate Of Ruth M Scott
Bought by
Scott Mary Ellen and Scott Gene Marie
Home Financials for this Owner
Home Financials are based on the most recent Mortgage that was taken out on this home.
Original Mortgage
$113,590
Interest Rate
8.14%
Purchase Details
Closed on
Apr 9, 1985
Sold by
Scott Clarence E
Bought by
Scott Ruth M
Purchase Details
Closed on
Feb 7, 1980
Sold by
Scott Clarence E and Scott Ruth M
Bought by
Scott Clarence E
Purchase Details
Closed on
Jan 1, 1975
Bought by
Scott Clarence E and Scott Ruth M
Create a Home Valuation Report for This Property
The Home Valuation Report is an in-depth analysis detailing your home's value as well as a comparison with similar homes in the area
Home Values in the Area
Average Home Value in this Area
Purchase History
| Date | Buyer | Sale Price | Title Company |
|---|---|---|---|
| Scott Mary Ellen | -- | -- | |
| Scott Mary Ellen | -- | -- | |
| Scott Ruth M | -- | -- | |
| Scott Clarence E | -- | -- | |
| Scott Clarence E | -- | -- |
Source: Public Records
Mortgage History
| Date | Status | Borrower | Loan Amount |
|---|---|---|---|
| Previous Owner | Scott Mary Ellen | $113,590 |
Source: Public Records
Tax History Compared to Growth
Tax History
| Year | Tax Paid | Tax Assessment Tax Assessment Total Assessment is a certain percentage of the fair market value that is determined by local assessors to be the total taxable value of land and additions on the property. | Land | Improvement |
|---|---|---|---|---|
| 2024 | $3,934 | $73,990 | $12,810 | $61,180 |
| 2023 | $3,731 | $57,930 | $12,600 | $45,330 |
| 2022 | $3,706 | $57,930 | $12,600 | $45,330 |
| 2021 | $3,685 | $57,930 | $12,600 | $45,330 |
| 2020 | $3,611 | $49,910 | $10,850 | $39,060 |
| 2019 | $3,509 | $142,600 | $31,000 | $111,600 |
| 2018 | $3,355 | $49,910 | $10,850 | $39,060 |
| 2017 | $3,465 | $45,680 | $9,870 | $35,810 |
| 2016 | $3,438 | $45,680 | $9,870 | $35,810 |
| 2015 | $3,239 | $45,680 | $9,870 | $35,810 |
| 2014 | $3,239 | $45,680 | $9,870 | $35,810 |
Source: Public Records
Map
Nearby Homes
- 7381 Grant Blvd
- 7334 Grant Blvd
- 16365 Barriemore Ave
- 16691 Craigmere Dr
- 15861 Glenridge Ave
- 7254 Craigmere Dr
- 16347 Craigmere Dr
- 7221 Craigmere Dr
- 7470 Lanier Dr
- 7364 Pearl Rd
- 7475 Lanier Dr
- 7400 Engle Rd
- 7344 Engle Rd
- 7280 Pearl Rd
- 16147 Ramona Dr
- 14750 Seneca Trail
- 7432 Baldwin Creek Dr
- 15983 Galemore Dr
- 7446 Pinewood Dr
- 16475 Heather Ln Unit S202
- 7370 Brookside Pkwy
- 7370 Big Creek Pkwy
- 7380 Big Creek Pkwy
- 16557 Brinbourne Ave
- 7386 Brookside Pkwy
- 16694 Bardbury Ave
- 16581 Brinbourne Ave
- 7360 Brookside Pkwy
- 16720 Bardbury Ave
- 16605 Brinbourne Ave
- 16746 Bardbury Ave
- 16558 Brinbourne Ave
- 7354 Brookside Pkwy
- 7394 Brookside Pkwy
- 16629 Brinbourne Ave
- 16582 Brinbourne Ave
- 16770 Bardbury Ave
- 16606 Brinbourne Ave
- 16653 Brinbourne Ave
- 7348 Big Creek Pkwy