7374 Preen St North Las Vegas, NV 89084
Aliante NeighborhoodEstimated Value: $582,608 - $617,000
3
Beds
2
Baths
2,196
Sq Ft
$276/Sq Ft
Est. Value
About This Home
This home is located at 7374 Preen St, North Las Vegas, NV 89084 and is currently estimated at $606,652, approximately $276 per square foot. 7374 Preen St is a home located in Clark County with nearby schools including Vincent L. Triggs Elementary School, Anthony Saville Middle School, and Shadow Ridge High School.
Ownership History
Date
Name
Owned For
Owner Type
Purchase Details
Closed on
Feb 14, 2020
Sold by
Holmes Bobby and Holmes Rosezita A
Bought by
Wiley Deane C and Wiley Alesia A
Current Estimated Value
Purchase Details
Closed on
Dec 1, 2016
Sold by
Holmes Bobby and Holmes Rosezita A
Bought by
Holmes Bobby and Holmes Rosezita A
Purchase Details
Closed on
Jun 16, 2011
Sold by
The Bank Of New York Mellon
Bought by
Holmes Bobby and Holmes Rosezita A
Purchase Details
Closed on
May 2, 2011
Sold by
Hansen Nels C and Hansen Cecilia A
Bought by
The Bank Of New York Mellon and First Horizon Home Loans
Purchase Details
Closed on
Feb 24, 2006
Sold by
Pn Ii Inc
Bought by
Hansen Nels C and Hansen Cecilia A
Home Financials for this Owner
Home Financials are based on the most recent Mortgage that was taken out on this home.
Original Mortgage
$465,629
Interest Rate
6.15%
Mortgage Type
Balloon
Purchase Details
Closed on
Sep 14, 2005
Sold by
North Valley Enterprises Llc
Bought by
Pn Ii Inc
Create a Home Valuation Report for This Property
The Home Valuation Report is an in-depth analysis detailing your home's value as well as a comparison with similar homes in the area
Home Values in the Area
Average Home Value in this Area
Purchase History
| Date | Buyer | Sale Price | Title Company |
|---|---|---|---|
| Wiley Deane C | $440,000 | First American Title | |
| Holmes Bobby | -- | None Available | |
| Holmes Bobby | $221,000 | Chicago Title Las Vegas | |
| The Bank Of New York Mellon | $186,750 | None Available | |
| Hansen Nels C | $467,154 | Lawyers Title Of Nevada | |
| Pn Ii Inc | -- | First Amer Title Co Of Nv | |
| Pn Ii Inc | $4,681,650 | First Amer Title Co Of Nv |
Source: Public Records
Mortgage History
| Date | Status | Borrower | Loan Amount |
|---|---|---|---|
| Previous Owner | Hansen Nels C | $465,629 |
Source: Public Records
Tax History Compared to Growth
Tax History
| Year | Tax Paid | Tax Assessment Tax Assessment Total Assessment is a certain percentage of the fair market value that is determined by local assessors to be the total taxable value of land and additions on the property. | Land | Improvement |
|---|---|---|---|---|
| 2025 | $3,480 | $183,566 | $45,150 | $138,416 |
| 2024 | $3,379 | $183,566 | $45,150 | $138,416 |
| 2023 | $3,379 | $200,469 | $49,350 | $151,119 |
| 2022 | $3,281 | $162,080 | $41,300 | $120,780 |
| 2021 | $3,186 | $141,955 | $36,750 | $105,205 |
| 2020 | $3,090 | $135,132 | $36,400 | $98,732 |
| 2019 | $3,000 | $132,497 | $32,900 | $99,597 |
| 2018 | $2,913 | $123,752 | $27,650 | $96,102 |
| 2017 | $3,849 | $113,119 | $26,250 | $86,869 |
| 2016 | $2,758 | $101,866 | $18,550 | $83,316 |
| 2015 | $2,752 | $95,359 | $18,550 | $76,809 |
| 2014 | $2,672 | $78,373 | $12,250 | $66,123 |
Source: Public Records
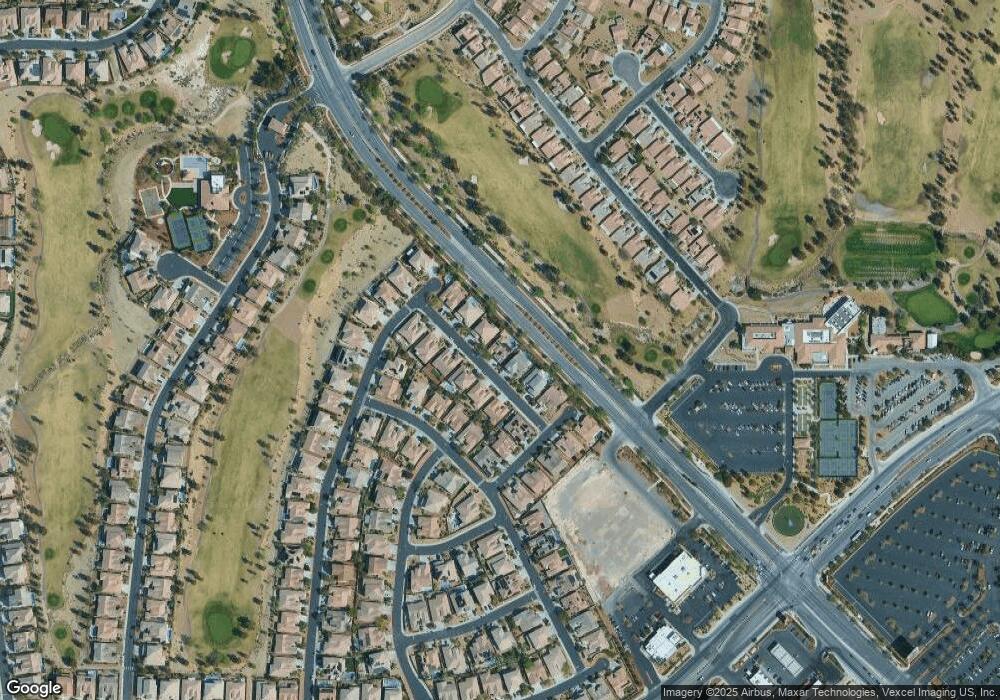
Map
Nearby Homes
- 7381 Summer Duck Way
- 7416 Redhead Dr
- 7316 Bugler Swan Way
- 7312 Pinfeather Way
- 3805 Avian Ct
- 7332 Redhead Dr
- 7264 Summer Duck Way
- 3705 Nesting Wren Dr
- 3425 Fledgling Dr
- 7633 Lily Trotter St
- 3717 Fledgling Dr
- 7616 Quail Dust St
- 7505 Java Sparrow St Unit 1
- 3109 Frigate Way
- 7713 Lily Trotter St
- 7209 Millerbird St
- 7617 Fieldfare Dr
- 7469 Crested Quail St
- 7073 Seabirds Place
- 4132 Campriani Ave
- 7378 Preen St
- 7370 Preen St
- 7382 Preen St
- 7366 Preen St
- 7375 Preen St
- 7371 Preen St
- 7371 Preen St Unit n/a
- 7379 Preen St
- 7367 Preen St
- 7383 Preen St
- 7362 Preen St Unit 3
- 7386 Preen St
- 3414 Singer Ln Unit 3
- 7368 Summer Duck Way
- 7372 Summer Duck Way
- 7387 Preen St
- 7364 Summer Duck Way
- 7376 Summer Duck Way
- 7376 Summer Duck Way - C3
- 3418 Singer Ln