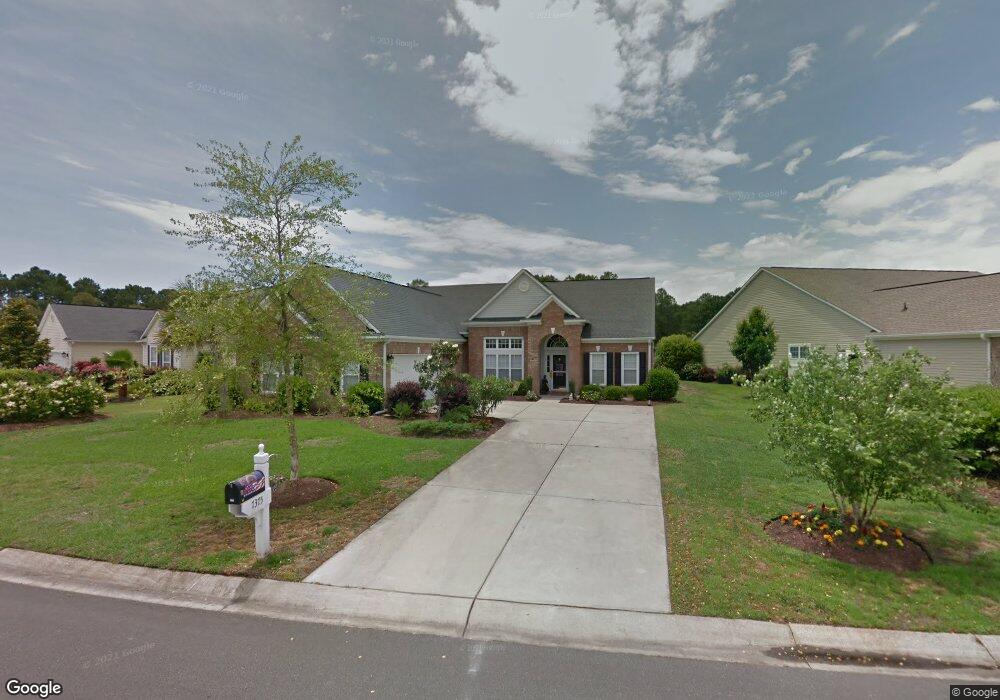
7375 Balmore Dr SW Sunset Beach, NC 28468
Estimated Value: $453,000 - $570,000
4
Beds
4
Baths
2,401
Sq Ft
$216/Sq Ft
Est. Value
About This Home
This home is located at 7375 Balmore Dr SW, Sunset Beach, NC 28468 and is currently estimated at $518,908, approximately $216 per square foot. 7375 Balmore Dr SW is a home located in Brunswick County with nearby schools including Jessie Mae Monroe Elementary School, Shallotte Middle School, and West Brunswick High School.
Ownership History
Date
Name
Owned For
Owner Type
Purchase Details
Closed on
Jan 7, 2011
Sold by
Williams Frederick A and Williams Diana Lynn
Bought by
Mcsweeney James J and Mcsweeney Patricia A
Current Estimated Value
Home Financials for this Owner
Home Financials are based on the most recent Mortgage that was taken out on this home.
Original Mortgage
$283,500
Outstanding Balance
$190,488
Interest Rate
4.48%
Mortgage Type
New Conventional
Estimated Equity
$328,420
Purchase Details
Closed on
Jun 10, 2005
Sold by
Centex Homes
Bought by
Williams Frederick A and Williams Diane Lynn
Home Financials for this Owner
Home Financials are based on the most recent Mortgage that was taken out on this home.
Original Mortgage
$208,000
Interest Rate
5.69%
Mortgage Type
New Conventional
Create a Home Valuation Report for This Property
The Home Valuation Report is an in-depth analysis detailing your home's value as well as a comparison with similar homes in the area
Home Values in the Area
Average Home Value in this Area
Purchase History
| Date | Buyer | Sale Price | Title Company |
|---|---|---|---|
| Mcsweeney James J | $315,000 | None Available | |
| Williams Frederick A | $326,000 | None Available |
Source: Public Records
Mortgage History
| Date | Status | Borrower | Loan Amount |
|---|---|---|---|
| Open | Mcsweeney James J | $283,500 | |
| Previous Owner | Williams Frederick A | $208,000 |
Source: Public Records
Tax History Compared to Growth
Tax History
| Year | Tax Paid | Tax Assessment Tax Assessment Total Assessment is a certain percentage of the fair market value that is determined by local assessors to be the total taxable value of land and additions on the property. | Land | Improvement |
|---|---|---|---|---|
| 2025 | $2,727 | $463,620 | $75,000 | $388,620 |
| 2024 | $2,727 | $463,620 | $75,000 | $388,620 |
| 2023 | $2,412 | $463,620 | $75,000 | $388,620 |
| 2022 | $2,412 | $312,140 | $65,000 | $247,140 |
| 2021 | $2,412 | $312,140 | $65,000 | $247,140 |
| 2020 | $2,412 | $312,140 | $65,000 | $247,140 |
| 2019 | $2,412 | $67,490 | $65,000 | $2,490 |
| 2018 | $2,166 | $55,000 | $52,000 | $3,000 |
| 2017 | $2,082 | $55,000 | $52,000 | $3,000 |
| 2016 | $2,032 | $55,000 | $52,000 | $3,000 |
| 2015 | $2,032 | $284,000 | $52,000 | $232,000 |
| 2014 | $1,817 | $295,392 | $95,000 | $200,392 |
Source: Public Records
Map
Nearby Homes
- 864 Sandpiper Bay Dr SW
- 943 Sandpiper Bay Dr SW
- 912 Great Egret Cir SW Unit 20c
- 884 Great Egret Cir SW Unit 6
- 916 Great Egret Cir SW Unit 21-D
- 882 Great Egret Cir SW Unit B
- 882 Great Egret Cir SW Unit 4
- 886 Great Egret Cir SW Unit 13D
- 874 Great Egret Cir SW Unit 7c
- 881 Great Egret Cir SW Unit 5
- 881 Great Egret Cir SW Unit F
- 881 Great Egret Cir SW Unit 59E
- 870 Great Egret Cir SW Unit 5F
- 7473 Balmore Dr SW
- 864 Great Egret Cir SW Unit 2
- 7480 Prestwick Ct SW
- 7505 Moorhen Ln SW Unit 2
- 948 Great Egret Cir SW Unit 28d
- 977 Great Egret Cir SW Unit D
- 977 Great Egret Cir SW Unit 4
- 7371 Balmore Dr SW
- 7379 Balmore Dr SW
- 7381 Balmore Dr SW
- 7367 Balmore Dr SW
- 7383 Balmore Dr SW
- 7365 Balmore Dr SW
- 7374 Balmore Dr SW
- 7372 Balmore Dr SW
- 7376 Balmore Dr SW
- 7378 Balmore Dr
- 7378 Balmore Dr SW
- 7370 Balmore Dr SW
- 7385 Balmore Dr SW
- 7380 Balmore Dr SW
- 7368 Balmore Dr SW
- 7366 Balmore Dr SW
- 7382 Balmore Dr SW
- 7366 Balmore Dr Dr SW
- 7363 Balmore Dr SW
- 7387 Balmore Dr SW