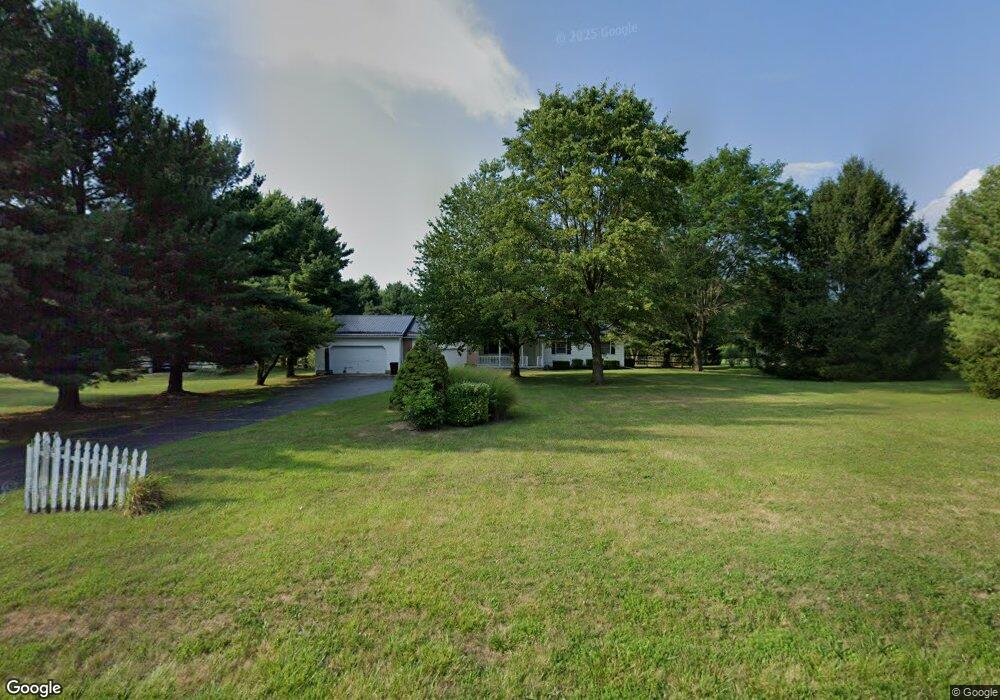
7378 Beecher Rd SW Pataskala, OH 43062
Harrison NeighborhoodEstimated Value: $397,000 - $432,338
3
Beds
2
Baths
1,989
Sq Ft
$209/Sq Ft
Est. Value
About This Home
This home is located at 7378 Beecher Rd SW, Pataskala, OH 43062 and is currently estimated at $415,085, approximately $208 per square foot. 7378 Beecher Rd SW is a home located in Licking County with nearby schools including Kirkersville Elementary School, Etna Elementary School, and Watkins Middle School.
Ownership History
Date
Name
Owned For
Owner Type
Purchase Details
Closed on
Feb 26, 2015
Sold by
Porter Ronald T and Porter Karen E
Bought by
Porter Ronald T
Current Estimated Value
Home Financials for this Owner
Home Financials are based on the most recent Mortgage that was taken out on this home.
Original Mortgage
$145,679
Outstanding Balance
$112,353
Interest Rate
3.87%
Mortgage Type
FHA
Estimated Equity
$302,732
Purchase Details
Closed on
Apr 23, 1996
Sold by
Everman J William
Bought by
Porter Ronald T and Cosack Karen E
Home Financials for this Owner
Home Financials are based on the most recent Mortgage that was taken out on this home.
Original Mortgage
$103,100
Interest Rate
7.44%
Mortgage Type
New Conventional
Purchase Details
Closed on
Apr 12, 1995
Sold by
Yankee Michael D
Bought by
Everman William J and Everman Dianna L
Home Financials for this Owner
Home Financials are based on the most recent Mortgage that was taken out on this home.
Original Mortgage
$118,750
Interest Rate
8.5%
Mortgage Type
New Conventional
Create a Home Valuation Report for This Property
The Home Valuation Report is an in-depth analysis detailing your home's value as well as a comparison with similar homes in the area
Home Values in the Area
Average Home Value in this Area
Purchase History
| Date | Buyer | Sale Price | Title Company |
|---|---|---|---|
| Porter Ronald T | -- | Capital Title | |
| Porter Ronald T | $128,900 | -- | |
| Everman William J | $125,000 | -- |
Source: Public Records
Mortgage History
| Date | Status | Borrower | Loan Amount |
|---|---|---|---|
| Open | Porter Ronald T | $145,679 | |
| Closed | Porter Ronald T | $103,100 | |
| Previous Owner | Everman William J | $118,750 |
Source: Public Records
Tax History Compared to Growth
Tax History
| Year | Tax Paid | Tax Assessment Tax Assessment Total Assessment is a certain percentage of the fair market value that is determined by local assessors to be the total taxable value of land and additions on the property. | Land | Improvement |
|---|---|---|---|---|
| 2024 | $4,967 | $122,120 | $34,410 | $87,710 |
| 2023 | $4,831 | $122,120 | $34,410 | $87,710 |
| 2022 | $3,702 | $81,940 | $18,900 | $63,040 |
| 2021 | $3,788 | $81,940 | $18,900 | $63,040 |
| 2020 | $3,845 | $81,940 | $18,900 | $63,040 |
| 2019 | $3,150 | $64,230 | $15,750 | $48,480 |
| 2018 | $3,531 | $0 | $0 | $0 |
| 2017 | $3,517 | $0 | $0 | $0 |
| 2016 | $2,997 | $0 | $0 | $0 |
| 2015 | $2,887 | $0 | $0 | $0 |
| 2014 | $2,079 | $0 | $0 | $0 |
| 2013 | $2,841 | $0 | $0 | $0 |
Source: Public Records
Map
Nearby Homes
- 127 Twenty Grand Rd SW
- 180 Jefferson Ridge Dr
- 344 Virginia Ct Unit 344
- 348 Virginia Ct Unit 348
- 5364 York Rd SW Unit lot 127
- 401 Virginia Ct Unit 401
- 7948 Columbus Rd SW
- 13300 E Broad St SW
- 0 Watkins Rd SW
- 128 Winter Green Loop SW
- 0 York Rd SW Unit 225014420
- 322 Weatherburn Dr
- 131 Stonegate Dr Unit 131
- 150 Mannaseh Dr W
- 0 Ashcraft Dr Unit Lot 27-A 225031190
- 180 Riva Ridge Rd SW
- 7945 Blacks Rd SW
- 215 Mannaseh Dr W
- 1333 Andy Way
- 173 Mannaseh Dr E
- 7348 Beecher Rd SW
- 7408 Beecher Rd SW
- 7234 Beecher Rd SW
- 7438 Beecher Rd SW
- 33 Lawrin Ct SW
- 7300 Beecher Rd SW
- 563 Chateaugay Dr
- 7313 Beecher Rd SW
- 585 Chateaugay Dr
- 503 Chateaugay Dr
- 7291 Beecher Rd SW
- 607 Chateaugay Dr
- 30 Twenty Grand Rd SW
- 52 Twenty Grand Rd SW
- 32 Lawrin Ct SW
- 7269 Beecher Rd SW
- 7276 Beecher Rd SW
- 86 Twenty Grand Rd SW
- 45 Lawrin Ct SW
- 459 Chateaugay Dr SW