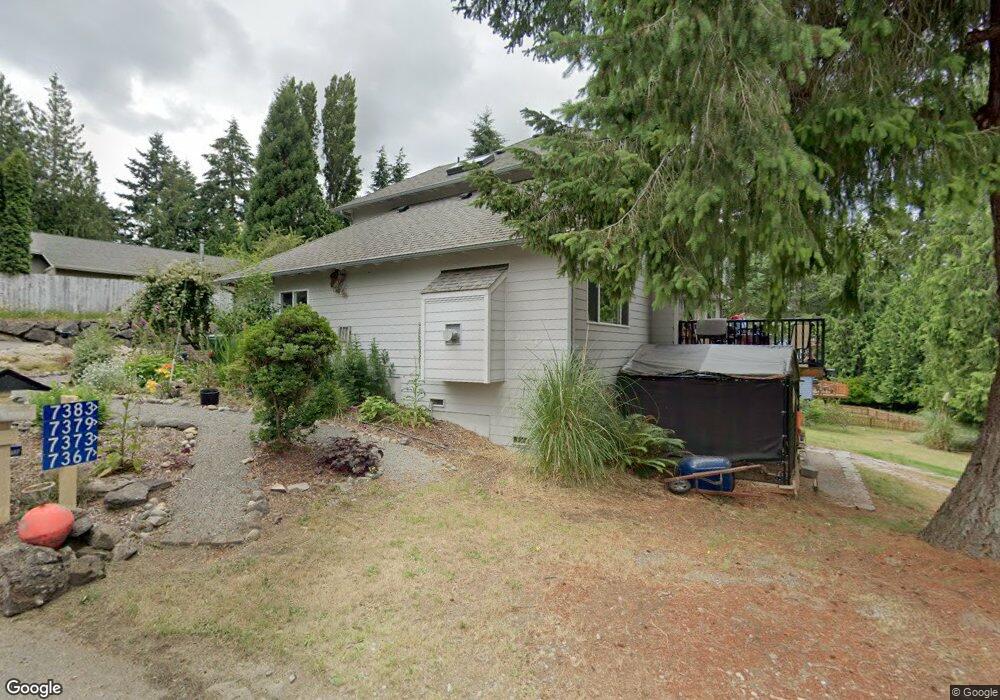
7379 Haynes Ln NE Bremerton, WA 98311
Estimated Value: $529,000 - $601,000
4
Beds
3
Baths
1,954
Sq Ft
$294/Sq Ft
Est. Value
About This Home
This home is located at 7379 Haynes Ln NE, Bremerton, WA 98311 and is currently estimated at $575,178, approximately $294 per square foot. 7379 Haynes Ln NE is a home located in Kitsap County with nearby schools including Esquire Hills Elementary School, Fairview Middle School, and Olympic High School.
Ownership History
Date
Name
Owned For
Owner Type
Purchase Details
Closed on
Dec 8, 2011
Sold by
Pigeon Gregory S and Pigeon Nancy J
Bought by
Robbins Joshua D and Robbins Anna C
Current Estimated Value
Home Financials for this Owner
Home Financials are based on the most recent Mortgage that was taken out on this home.
Original Mortgage
$174,400
Outstanding Balance
$118,900
Interest Rate
3.94%
Mortgage Type
New Conventional
Estimated Equity
$456,278
Purchase Details
Closed on
Oct 25, 1995
Sold by
Chaffey Corp
Bought by
Pigeon Gregory S and Pigeon Nancy J
Home Financials for this Owner
Home Financials are based on the most recent Mortgage that was taken out on this home.
Original Mortgage
$166,860
Interest Rate
7.59%
Mortgage Type
VA
Create a Home Valuation Report for This Property
The Home Valuation Report is an in-depth analysis detailing your home's value as well as a comparison with similar homes in the area
Home Values in the Area
Average Home Value in this Area
Purchase History
| Date | Buyer | Sale Price | Title Company |
|---|---|---|---|
| Robbins Joshua D | $218,280 | Pacific Nw Title | |
| Pigeon Gregory S | $162,000 | Land Title Company |
Source: Public Records
Mortgage History
| Date | Status | Borrower | Loan Amount |
|---|---|---|---|
| Open | Robbins Joshua D | $174,400 | |
| Previous Owner | Pigeon Gregory S | $166,860 |
Source: Public Records
Tax History Compared to Growth
Tax History
| Year | Tax Paid | Tax Assessment Tax Assessment Total Assessment is a certain percentage of the fair market value that is determined by local assessors to be the total taxable value of land and additions on the property. | Land | Improvement |
|---|---|---|---|---|
| 2026 | $4,922 | $522,570 | $119,550 | $403,020 |
| 2025 | $4,922 | $522,570 | $119,550 | $403,020 |
| 2024 | $4,788 | $522,570 | $119,550 | $403,020 |
| 2023 | $4,805 | $522,570 | $119,550 | $403,020 |
| 2022 | $4,524 | $433,220 | $98,800 | $334,420 |
| 2021 | $4,309 | $392,300 | $73,300 | $319,000 |
| 2020 | $4,025 | $370,640 | $69,170 | $301,470 |
| 2019 | $3,752 | $334,140 | $62,460 | $271,680 |
| 2018 | $4,021 | $277,730 | $51,620 | $226,110 |
| 2017 | $3,572 | $277,730 | $51,620 | $226,110 |
| 2016 | $3,471 | $249,410 | $46,090 | $203,320 |
| 2015 | -- | $234,340 | $51,060 | $183,280 |
| 2014 | -- | $223,380 | $51,060 | $172,320 |
| 2013 | -- | $223,380 | $51,060 | $172,320 |
Source: Public Records
Map
Nearby Homes
- 7265 Thasos Ave NE
- 7726 Lazy s Ln NE
- 7020 Saint Charles Ln NE
- 7655 Forest Ridge Dr NE
- 0 Kaster Dr NE
- 2940 Osiris Ct NE
- 3924 McCormick Village Dr Unit 25
- 3000 NE Loyola St
- 2112 NE Lexington Dr
- 2348 NE Windsor Ct
- 8065 Autumn Hills Place NE
- 3060 NE Mcwilliams Rd Unit 104
- 3060 NE Mcwilliams Rd Unit 124
- 3060 NE Mcwilliams Rd Unit 9
- 6522 State Hwy 303 NE
- 9422 Fairhaven Cir NE
- 1858 NE Mcwilliams Rd
- 8259 Kaster Dr NE
- 3703 NE Trout Brook Ln
- 7761 Beacon Place NE Unit 103
- 7373 Haynes Ln NE
- 7383 Haynes Ln NE
- 7393 Haynes Ln NE
- 2374 NE Meadowlark Cir
- 7348 Lazy s Ln NE
- 7354 Lazy s Ln NE
- 7385 Haynes Ln NE
- 2362 NE Meadowlark Cir
- 7367 Haynes Ln NE
- 2375 NE Meadowlark Cir
- 7374 Lazy s Ln NE
- 7330 Lazy s Ln NE
- 7384 Haynes Ln NE
- 7390 Haynes Ln NE
- 7382 Haynes Ln NE
- 7380 Haynes Ln NE
- 7380 Haynes Ln NE
- 2365 NE Meadowlark Cir
- 7184 Sheffield Ct NE
- 7425 Wembly Ave NE