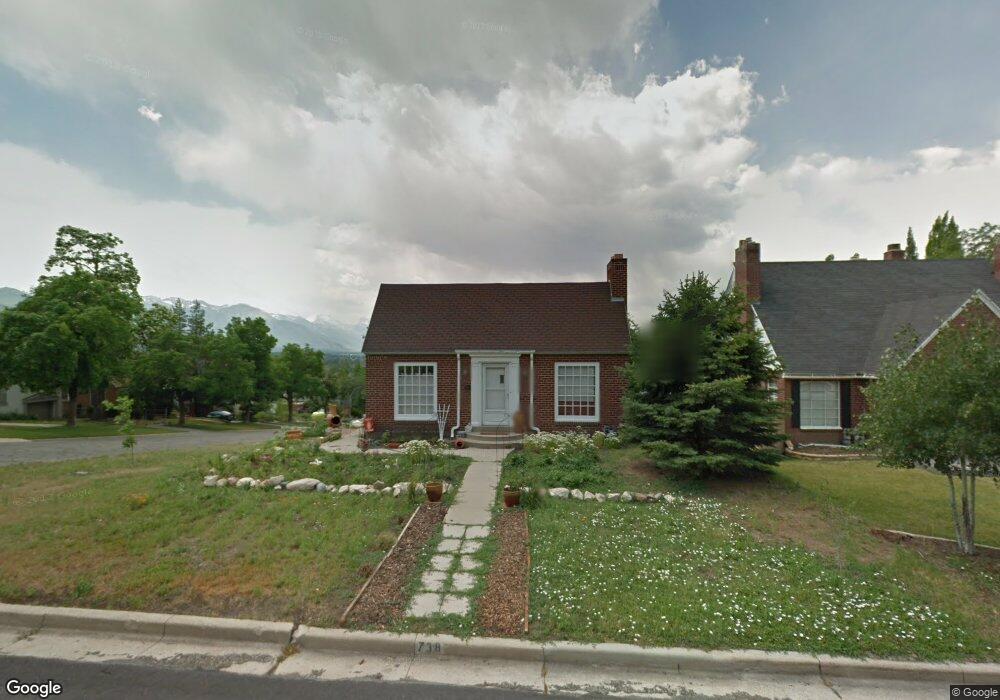
738 10th Ave Salt Lake City, UT 84103
The Avenues NeighborhoodEstimated Value: $596,000 - $688,000
2
Beds
1
Bath
1,620
Sq Ft
$393/Sq Ft
Est. Value
About This Home
This home is located at 738 10th Ave, Salt Lake City, UT 84103 and is currently estimated at $637,119, approximately $393 per square foot. 738 10th Ave is a home located in Salt Lake County with nearby schools including Ensign School, West High, and Open Classroom.
Ownership History
Date
Name
Owned For
Owner Type
Purchase Details
Closed on
Jun 16, 2004
Sold by
Thompson Doris J and Pack Pat F
Bought by
Piercey H Dennis
Current Estimated Value
Home Financials for this Owner
Home Financials are based on the most recent Mortgage that was taken out on this home.
Original Mortgage
$151,200
Outstanding Balance
$74,358
Interest Rate
6.09%
Mortgage Type
Unknown
Estimated Equity
$562,761
Purchase Details
Closed on
Apr 3, 2001
Sold by
Nemelka Walter J and Nemelka Lillie Maurer
Bought by
Thompson Doris J and Pack Pat F
Create a Home Valuation Report for This Property
The Home Valuation Report is an in-depth analysis detailing your home's value as well as a comparison with similar homes in the area
Home Values in the Area
Average Home Value in this Area
Purchase History
| Date | Buyer | Sale Price | Title Company |
|---|---|---|---|
| Piercey H Dennis | -- | Surety Title | |
| Thompson Doris J | -- | -- |
Source: Public Records
Mortgage History
| Date | Status | Borrower | Loan Amount |
|---|---|---|---|
| Open | Piercey H Dennis | $151,200 |
Source: Public Records
Tax History Compared to Growth
Tax History
| Year | Tax Paid | Tax Assessment Tax Assessment Total Assessment is a certain percentage of the fair market value that is determined by local assessors to be the total taxable value of land and additions on the property. | Land | Improvement |
|---|---|---|---|---|
| 2025 | $2,586 | $544,000 | $247,100 | $296,900 |
| 2024 | $2,586 | $493,500 | $235,900 | $257,600 |
| 2023 | $2,560 | $470,900 | $226,800 | $244,100 |
| 2022 | $2,819 | $486,500 | $159,000 | $327,500 |
| 2021 | $2,509 | $391,900 | $129,200 | $262,700 |
| 2020 | $2,463 | $366,300 | $120,800 | $245,500 |
| 2019 | $2,029 | $283,800 | $112,700 | $171,100 |
| 2018 | $1,948 | $265,400 | $112,700 | $152,700 |
| 2017 | $2,006 | $256,100 | $112,700 | $143,400 |
| 2016 | $1,953 | $236,700 | $108,000 | $128,700 |
| 2015 | $1,946 | $223,600 | $104,600 | $119,000 |
| 2014 | $1,889 | $215,300 | $104,600 | $110,700 |
Source: Public Records
Map
Nearby Homes