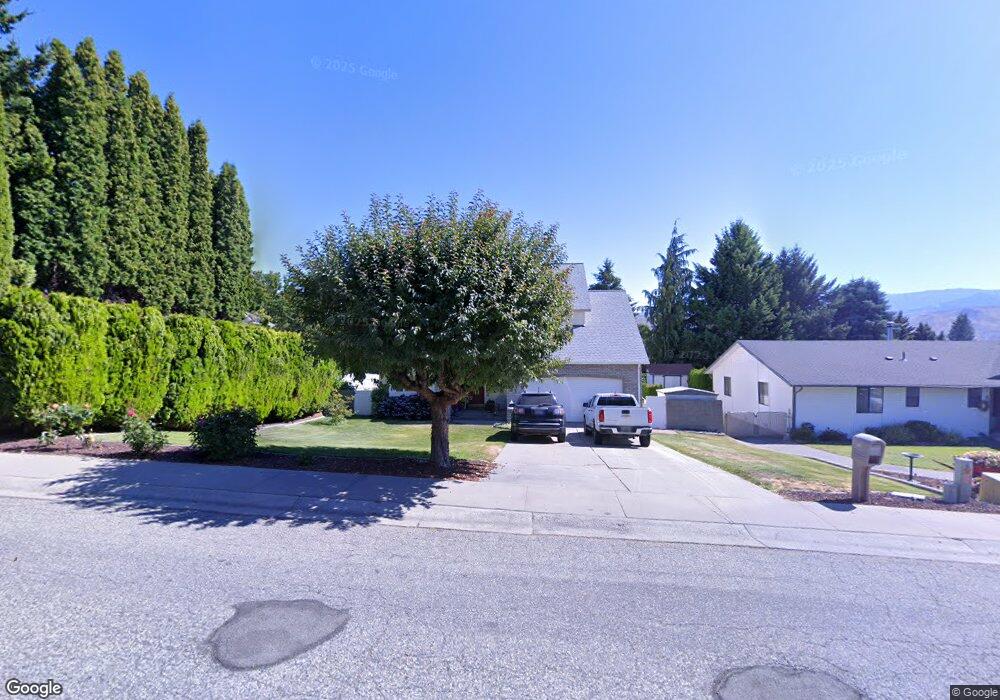
738 12th St NE East Wenatchee, WA 98802
Estimated Value: $503,000 - $646,000
3
Beds
3
Baths
1,684
Sq Ft
$344/Sq Ft
Est. Value
About This Home
This home is located at 738 12th St NE, East Wenatchee, WA 98802 and is currently estimated at $578,983, approximately $343 per square foot. 738 12th St NE is a home located in Douglas County with nearby schools including Sterling Intermediate School, Lee Elementary School, and Eastmont Junior High School.
Ownership History
Date
Name
Owned For
Owner Type
Purchase Details
Closed on
Aug 17, 2021
Sold by
Hunter Alan R
Bought by
Hunter Alan R and Hunter Charlotte
Current Estimated Value
Home Financials for this Owner
Home Financials are based on the most recent Mortgage that was taken out on this home.
Original Mortgage
$220,000
Outstanding Balance
$200,048
Interest Rate
2.9%
Mortgage Type
New Conventional
Estimated Equity
$378,935
Purchase Details
Closed on
May 14, 2018
Sold by
Hunter Alan R and Estate Of Joan E Hunter
Bought by
Hunter Alan R
Purchase Details
Closed on
Nov 4, 2009
Sold by
Hunter Alan R
Bought by
Hunter Alan R and Hunter Joan E
Purchase Details
Closed on
Mar 24, 2008
Sold by
Warrington Kenneth A and Warrington Mary S
Bought by
Hunter Alan R
Home Financials for this Owner
Home Financials are based on the most recent Mortgage that was taken out on this home.
Original Mortgage
$186,130
Interest Rate
5.72%
Mortgage Type
New Conventional
Create a Home Valuation Report for This Property
The Home Valuation Report is an in-depth analysis detailing your home's value as well as a comparison with similar homes in the area
Home Values in the Area
Average Home Value in this Area
Purchase History
| Date | Buyer | Sale Price | Title Company |
|---|---|---|---|
| Hunter Alan R | -- | North Meridian T&E Llc | |
| Hunter Alan R | -- | None Available | |
| Hunter Alan R | -- | None Available | |
| Hunter Alan R | $266,226 | Pioneer Title Co |
Source: Public Records
Mortgage History
| Date | Status | Borrower | Loan Amount |
|---|---|---|---|
| Open | Hunter Alan R | $220,000 | |
| Closed | Hunter Alan R | $186,130 |
Source: Public Records
Tax History Compared to Growth
Tax History
| Year | Tax Paid | Tax Assessment Tax Assessment Total Assessment is a certain percentage of the fair market value that is determined by local assessors to be the total taxable value of land and additions on the property. | Land | Improvement |
|---|---|---|---|---|
| 2025 | $400 | $447,600 | $100,000 | $347,600 |
| 2024 | $400 | $423,600 | $100,000 | $323,600 |
| 2023 | $4,179 | $388,200 | $100,000 | $288,200 |
| 2022 | $3,410 | $300,100 | $80,000 | $220,100 |
| 2021 | $3,772 | $300,100 | $80,000 | $220,100 |
| 2020 | $3,448 | $309,400 | $72,000 | $237,400 |
| 2018 | $3,115 | $250,800 | $60,000 | $190,800 |
| 2017 | $2,820 | $250,800 | $60,000 | $190,800 |
| 2016 | $2,512 | $246,500 | $60,000 | $186,500 |
| 2015 | $2,405 | $225,200 | $60,000 | $165,200 |
| 2014 | -- | $206,700 | $60,000 | $146,700 |
| 2013 | -- | $202,400 | $60,000 | $142,400 |
Source: Public Records
Map
Nearby Homes
- 1040 Gilbert Ct
- 1352 Eastmont Ave Unit 15
- 520 11th St NE Unit 21
- 1055 N Jackson Ave
- 1494 Eastmont Ave Unit 56
- 1494 Eastmont Ave Unit 33
- 1494 Eastmont Ave Unit 58
- 946 Briarwood Dr
- 1653 Holly Ln
- 646 N Gale Place
- 845 N Devon Ave
- 1046 Corum Cir
- 1051 N Baker Ave Unit A-202
- 1051 N Baker Ave Unit B 203
- 902 N Kenroy Terrace
- 1218 N Ashland Ave
- 544 N Colorado Ave
- 772 N Keller Ave
- 800 N Kentucky Ave
- 3234 NW Chadwick (Lot 25) Loop
- 734 12th St NE
- 1120 N Grover Place
- 731 11th St NE
- 727 11th St NE
- 730 12th St NE
- 735 11th St NE
- 725 11th St NE
- 1150 N Grover Place
- 1131 N Grover Place
- 726 12th St NE
- 726 12th St NE Unit 1
- 1101 N Grover Place
- 721 11th St NE
- 1201 N Grover Place
- 732 11th St NE
- 722 12th St NE
- 804 12th St NE
- 805 11th St NE
- 730 11th St NE
- 722 13th St NE