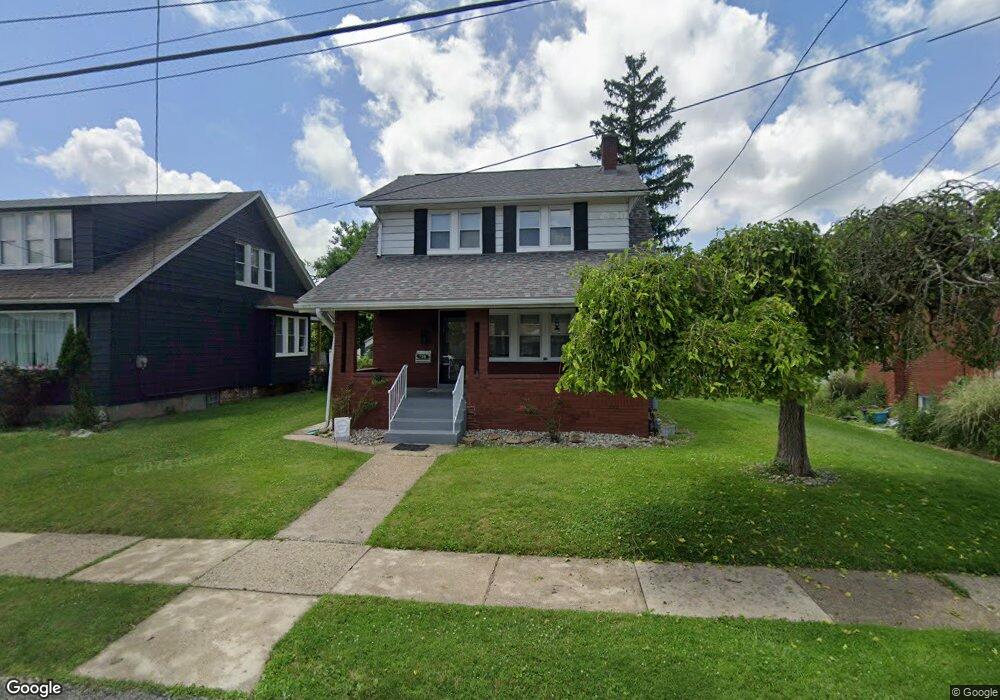
738 3rd Ave Verona, PA 15147
Estimated Value: $150,318 - $186,000
2
Beds
1
Bath
1,248
Sq Ft
$129/Sq Ft
Est. Value
About This Home
This home is located at 738 3rd Ave, Verona, PA 15147 and is currently estimated at $161,330, approximately $129 per square foot. 738 3rd Ave is a home located in Allegheny County with nearby schools including Riverview High School and Redeemer Lutheran School.
Ownership History
Date
Name
Owned For
Owner Type
Purchase Details
Closed on
Sep 7, 2017
Sold by
Loalbo Gerald Fred and Tamburro Karen Ann
Bought by
Boland Dawn M
Current Estimated Value
Home Financials for this Owner
Home Financials are based on the most recent Mortgage that was taken out on this home.
Original Mortgage
$70,000
Outstanding Balance
$58,502
Interest Rate
3.93%
Mortgage Type
New Conventional
Estimated Equity
$102,828
Purchase Details
Closed on
Jun 30, 1994
Sold by
Loalbo Gerald
Bought by
Tamburro Karen Ann and Loalbo Gerald Fred
Create a Home Valuation Report for This Property
The Home Valuation Report is an in-depth analysis detailing your home's value as well as a comparison with similar homes in the area
Home Values in the Area
Average Home Value in this Area
Purchase History
| Date | Buyer | Sale Price | Title Company |
|---|---|---|---|
| Boland Dawn M | $88,000 | Barristers Land Abstract Co | |
| Tamburro Karen Ann | -- | -- |
Source: Public Records
Mortgage History
| Date | Status | Borrower | Loan Amount |
|---|---|---|---|
| Open | Boland Dawn M | $70,000 |
Source: Public Records
Tax History Compared to Growth
Tax History
| Year | Tax Paid | Tax Assessment Tax Assessment Total Assessment is a certain percentage of the fair market value that is determined by local assessors to be the total taxable value of land and additions on the property. | Land | Improvement |
|---|---|---|---|---|
| 2025 | $1,639 | $42,500 | $20,200 | $22,300 |
| 2024 | $1,639 | $42,500 | $20,200 | $22,300 |
| 2023 | $1,619 | $42,500 | $20,200 | $22,300 |
| 2022 | $1,602 | $42,500 | $20,200 | $22,300 |
| 2021 | $201 | $42,500 | $20,200 | $22,300 |
| 2020 | $1,522 | $42,500 | $20,200 | $22,300 |
| 2019 | $1,510 | $42,500 | $20,200 | $22,300 |
| 2018 | $286 | $42,500 | $20,200 | $22,300 |
| 2017 | $2,116 | $60,500 | $20,200 | $40,300 |
| 2016 | $286 | $60,500 | $20,200 | $40,300 |
| 2015 | $286 | $60,500 | $20,200 | $40,300 |
| 2014 | $2,128 | $60,500 | $20,200 | $40,300 |
Source: Public Records
Map
Nearby Homes