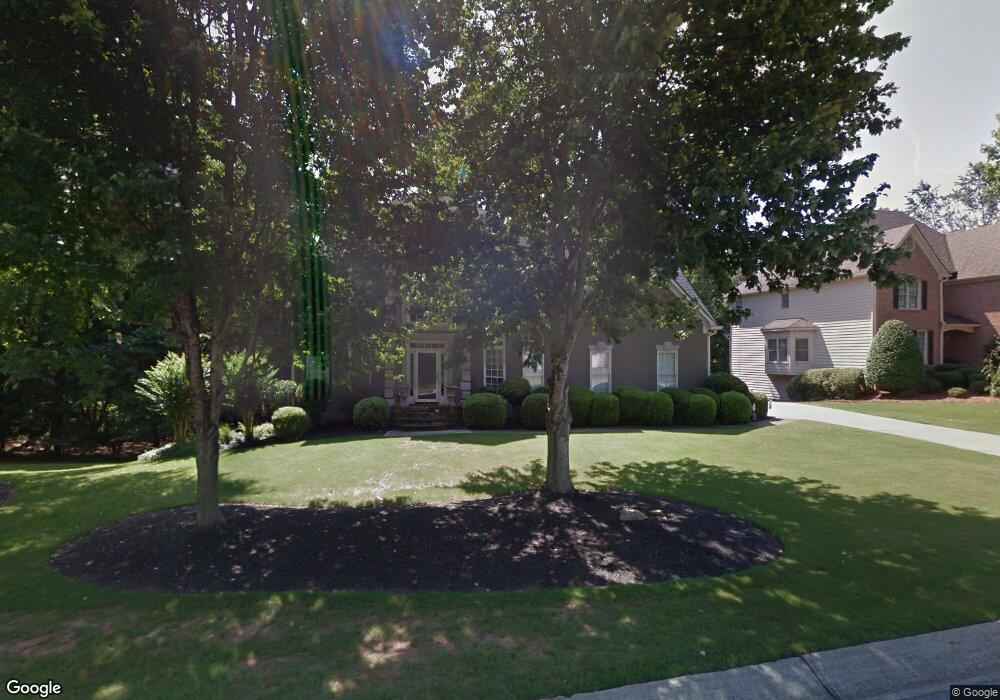
738 Amberton Crossing Unit 4 Suwanee, GA 30024
Estimated Value: $653,024 - $754,000
3
Beds
4
Baths
2,894
Sq Ft
$248/Sq Ft
Est. Value
About This Home
This home is located at 738 Amberton Crossing Unit 4, Suwanee, GA 30024 and is currently estimated at $716,756, approximately $247 per square foot. 738 Amberton Crossing Unit 4 is a home located in Gwinnett County with nearby schools including Level Creek Elementary School, North Gwinnett Middle School, and North Gwinnett High School.
Ownership History
Date
Name
Owned For
Owner Type
Purchase Details
Closed on
Feb 27, 2004
Sold by
Cavanaugh Michael J and Cavanaugh Catherine A
Bought by
Morejon Jorge and Morejon Marisa
Current Estimated Value
Home Financials for this Owner
Home Financials are based on the most recent Mortgage that was taken out on this home.
Original Mortgage
$231,920
Outstanding Balance
$108,769
Interest Rate
5.72%
Mortgage Type
New Conventional
Estimated Equity
$607,987
Purchase Details
Closed on
Sep 22, 1998
Sold by
Miller Mark H and Miller Robin G
Bought by
Cavanaugh Michael J
Home Financials for this Owner
Home Financials are based on the most recent Mortgage that was taken out on this home.
Original Mortgage
$225,150
Interest Rate
6.96%
Mortgage Type
New Conventional
Purchase Details
Closed on
Oct 25, 1995
Sold by
Laurel River Prop Inc
Bought by
Miller Mark H
Create a Home Valuation Report for This Property
The Home Valuation Report is an in-depth analysis detailing your home's value as well as a comparison with similar homes in the area
Home Values in the Area
Average Home Value in this Area
Purchase History
| Date | Buyer | Sale Price | Title Company |
|---|---|---|---|
| Morejon Jorge | $289,900 | -- | |
| Cavanaugh Michael J | $237,000 | -- | |
| Miller Mark H | $216,000 | -- |
Source: Public Records
Mortgage History
| Date | Status | Borrower | Loan Amount |
|---|---|---|---|
| Open | Morejon Jorge | $231,920 | |
| Previous Owner | Cavanaugh Michael J | $225,150 | |
| Closed | Miller Mark H | $0 |
Source: Public Records
Tax History Compared to Growth
Tax History
| Year | Tax Paid | Tax Assessment Tax Assessment Total Assessment is a certain percentage of the fair market value that is determined by local assessors to be the total taxable value of land and additions on the property. | Land | Improvement |
|---|---|---|---|---|
| 2024 | $5,846 | $235,640 | $48,000 | $187,640 |
| 2023 | $5,846 | $233,520 | $48,000 | $185,520 |
| 2022 | $6,002 | $191,920 | $48,000 | $143,920 |
| 2021 | $5,138 | $157,400 | $30,760 | $126,640 |
| 2020 | $5,177 | $157,400 | $30,760 | $126,640 |
| 2019 | $4,393 | $157,400 | $30,760 | $126,640 |
| 2018 | $4,062 | $141,120 | $30,760 | $110,360 |
| 2016 | $3,622 | $120,880 | $35,200 | $85,680 |
| 2015 | $3,520 | $114,200 | $28,400 | $85,800 |
| 2014 | $3,511 | $112,800 | $27,000 | $85,800 |
Source: Public Records
Map
Nearby Homes
- 4592 Campenille Ct
- 4569 Campenille Trace
- 1199 Bennett Creek Overlook
- 1179 Bennett Creek Overlook
- 1119 Bennett Creek Overlook
- 1309 Bennett Creek Overlook
- 735 Amberton Close
- 755 Amberton Close Unit 2
- 4335 Landover Way Unit 3
- 3450 Commander
- 4505 Whitestone Way
- 771 Woodvale Point
- 4544 Silver Peak Pkwy
- 829 Big Horn Hollow
- 4635 Whitestone Way
- 858 Red Rock Ct
- 655 Grove Manor Ct
- 758 Amberton Crossing
- 4594 Campenille Trace Unit 4
- 0 Amberton Crossing Unit 7089896
- 0 Amberton Crossing Unit 8486987
- 0 Amberton Crossing Unit 8386382
- 0 Amberton Crossing Unit 7603326
- 0 Amberton Crossing Unit 8324149
- 0 Amberton Crossing Unit 8992144
- 0 Amberton Crossing Unit 8837565
- 0 Amberton Crossing Unit 3209461
- 0 Amberton Crossing
- 4584 Campenille Trace Unit 34
- 4584 Campenille Trace
- 768 Amberton Crossing Unit 1
- 721 Amberton Crossing
- 741 Amberton Crossing Unit 4
- 751 Amberton Crossing Unit 2
- 751 Amberton Crossing
- 731 Amberton Crossing
- 4574 Campenille Trace