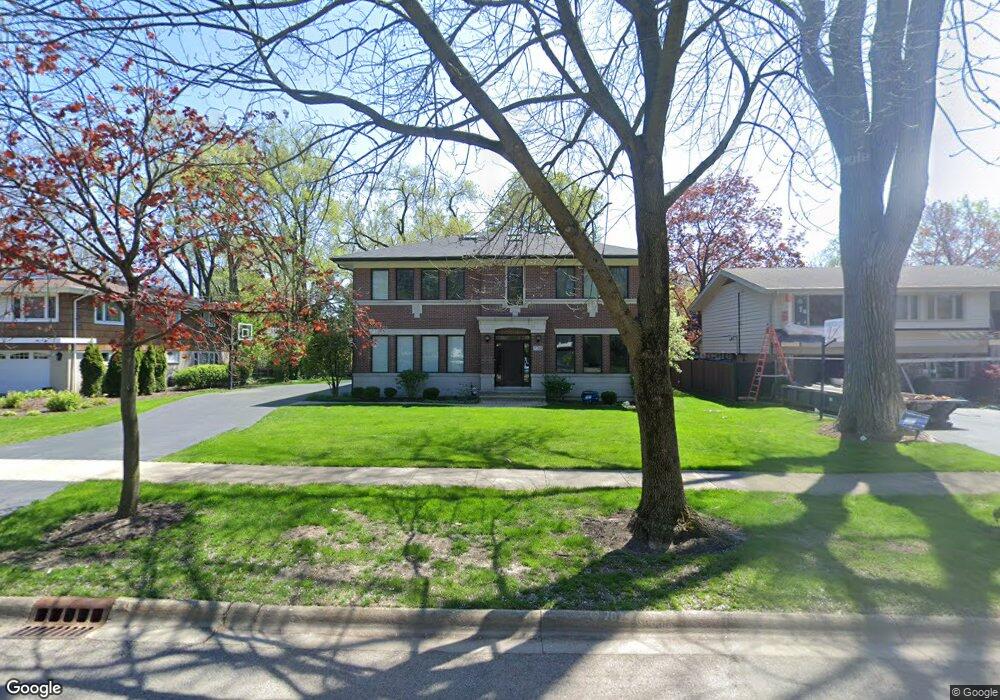
738 Apple Tree Ln Glencoe, IL 60022
Estimated Value: $1,278,000 - $1,615,000
4
Beds
4
Baths
3,336
Sq Ft
$427/Sq Ft
Est. Value
About This Home
This home is located at 738 Apple Tree Ln, Glencoe, IL 60022 and is currently estimated at $1,425,885, approximately $427 per square foot. 738 Apple Tree Ln is a home located in Cook County with nearby schools including South Elementary School, West School, and Central School.
Ownership History
Date
Name
Owned For
Owner Type
Purchase Details
Closed on
Mar 13, 2024
Sold by
Sussman Alan C and Sussman Jocelyn
Bought by
Sussman Alan C and Sussman Jocelyn
Current Estimated Value
Purchase Details
Closed on
Jun 3, 2003
Sold by
Gottlieb Arnold and Gottlieb Ruth
Bought by
Sussman Alan and Sussman Jocelyn
Home Financials for this Owner
Home Financials are based on the most recent Mortgage that was taken out on this home.
Original Mortgage
$367,200
Interest Rate
3.87%
Mortgage Type
Unknown
Purchase Details
Closed on
Oct 15, 1993
Sold by
Gottlieb Arnold and Gottlieb Ruth
Bought by
Gottlieb Arnold and Gottlieb Ruth
Create a Home Valuation Report for This Property
The Home Valuation Report is an in-depth analysis detailing your home's value as well as a comparison with similar homes in the area
Home Values in the Area
Average Home Value in this Area
Purchase History
| Date | Buyer | Sale Price | Title Company |
|---|---|---|---|
| Sussman Alan C | -- | None Listed On Document | |
| Sussman Alan | $459,000 | Multiple | |
| Sussman Alan | $459,000 | Multiple | |
| Gottlieb Arnold | -- | -- |
Source: Public Records
Mortgage History
| Date | Status | Borrower | Loan Amount |
|---|---|---|---|
| Previous Owner | Sussman Alan | $367,200 |
Source: Public Records
Tax History
| Year | Tax Paid | Tax Assessment Tax Assessment Total Assessment is a certain percentage of the fair market value that is determined by local assessors to be the total taxable value of land and additions on the property. | Land | Improvement |
|---|---|---|---|---|
| 2025 | $24,688 | $155,200 | $19,250 | $135,950 |
| 2024 | $24,688 | $97,000 | $18,700 | $78,300 |
| 2023 | $23,025 | $104,102 | $18,700 | $85,402 |
| 2022 | $23,025 | $104,102 | $18,700 | $85,402 |
| 2021 | $22,789 | $82,818 | $18,700 | $64,118 |
| 2020 | $22,188 | $82,818 | $18,700 | $64,118 |
| 2019 | $22,603 | $94,828 | $18,700 | $76,128 |
| 2018 | $21,012 | $86,090 | $15,400 | $70,690 |
| 2017 | $20,428 | $86,090 | $15,400 | $70,690 |
| 2016 | $20,552 | $91,127 | $15,400 | $75,727 |
| 2015 | $18,275 | $72,398 | $12,650 | $59,748 |
| 2014 | $17,837 | $72,398 | $12,650 | $59,748 |
| 2013 | $17,000 | $72,398 | $12,650 | $59,748 |
Source: Public Records
Map
Nearby Homes
- 754 Woodridge Ln
- 759 Strawberry Hill Dr
- 908 Elm Place
- 1106 Hohlfelder Rd
- 808 Prairie Rd
- 1036 Elm Ridge Dr
- 1020 Bluff Rd
- 396 Forest Edge Dr
- 1180 Oak Ridge Dr
- 1077 Green Bay Rd
- 794 Greenwood Ave
- 1076 Old Elm Ln
- 735 Grove St
- 488 Park Ave
- 476 Park Ave
- 1025 Longaker Rd
- 1013 Longaker Rd
- 378 South Ave
- 737 York Ct
- 130 Rockgate Ln
- 730 Apple Tree Ln
- 746 Apple Tree Ln
- 751 Woodridge Ln
- 745 Woodridge Ln
- 765 Woodridge Ln
- 724 Apple Tree Ln
- 741 Apple Tree Ln
- 725 Apple Tree Ln
- 749 Apple Tree Ln
- 733 Woodridge Ln
- 721 Apple Tree Ln
- 720 Apple Tree Ln
- 994 Cherry Tree Ln
- 990 Cherry Tree Ln
- 1000 Cherry Tree Ln
- 729 Woodridge Ln
- 980 Cherry Tree Ln
- 724 Willow Tree Ln
- 713 Apple Tree Ln
- 760 Woodridge Ln
Your Personal Tour Guide
Ask me questions while you tour the home.