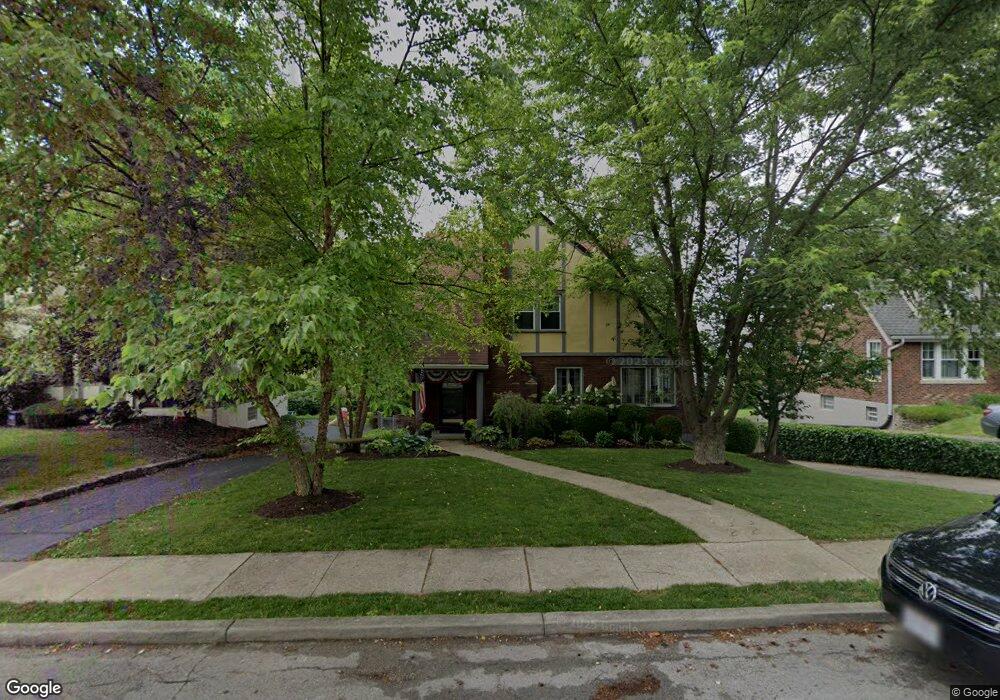
738 Avon Fields Ln Cincinnati, OH 45229
North Avondale NeighborhoodEstimated Value: $361,205 - $414,000
3
Beds
2
Baths
1,402
Sq Ft
$272/Sq Ft
Est. Value
About This Home
This home is located at 738 Avon Fields Ln, Cincinnati, OH 45229 and is currently estimated at $381,801, approximately $272 per square foot. 738 Avon Fields Ln is a home located in Hamilton County with nearby schools including South Avondale School, Clark Montessori High School, and Shroder High School.
Ownership History
Date
Name
Owned For
Owner Type
Purchase Details
Closed on
Jun 16, 2004
Sold by
Jgf Inc Tr
Bought by
Boesken Timothy J and Boesken Rhonda A
Current Estimated Value
Home Financials for this Owner
Home Financials are based on the most recent Mortgage that was taken out on this home.
Original Mortgage
$200,500
Interest Rate
6.37%
Mortgage Type
Unknown
Purchase Details
Closed on
Oct 24, 2002
Sold by
Paul John C and Paul Heather
Bought by
J G F Inc Tr
Home Financials for this Owner
Home Financials are based on the most recent Mortgage that was taken out on this home.
Original Mortgage
$200,500
Interest Rate
6.37%
Mortgage Type
Unknown
Purchase Details
Closed on
Jul 17, 1996
Sold by
Reeder Rodger W
Bought by
Paul John C and Paul Heather
Home Financials for this Owner
Home Financials are based on the most recent Mortgage that was taken out on this home.
Original Mortgage
$144,097
Interest Rate
8%
Mortgage Type
VA
Purchase Details
Closed on
Apr 14, 1994
Sold by
Vine William and Vine Melissa Marshall
Bought by
Roeder Rodger W
Home Financials for this Owner
Home Financials are based on the most recent Mortgage that was taken out on this home.
Original Mortgage
$126,900
Interest Rate
7.88%
Create a Home Valuation Report for This Property
The Home Valuation Report is an in-depth analysis detailing your home's value as well as a comparison with similar homes in the area
Home Values in the Area
Average Home Value in this Area
Purchase History
We collect this data history from publicly available records. To have your information removed, we recommend requesting removal directly through your county’s website.
| Date | Buyer | Sale Price | Title Company |
|---|---|---|---|
| Boesken Timothy J | $200,000 | -- | |
| J G F Inc Tr | $131,400 | -- | |
| Paul John C | $139,900 | -- | |
| Roeder Rodger W | -- | -- |
Source: Public Records
Mortgage History
We collect this data history from publicly available records. To have your information removed, we recommend requesting removal directly through your county’s website.
| Date | Status | Borrower | Loan Amount |
|---|---|---|---|
| Closed | Boesken Timothy J | $200,500 | |
| Previous Owner | J G F Inc Tr | $200,500 | |
| Previous Owner | Paul John C | $144,097 | |
| Previous Owner | Roeder Rodger W | $126,900 |
Source: Public Records
Tax History
| Year | Tax Paid | Tax Assessment Tax Assessment Total Assessment is a certain percentage of the fair market value that is determined by local assessors to be the total taxable value of land and additions on the property. | Land | Improvement |
|---|---|---|---|---|
| 2025 | $6,189 | $100,433 | $23,272 | $77,161 |
| 2024 | $6,001 | $100,433 | $23,272 | $77,161 |
| 2023 | $6,137 | $100,433 | $23,272 | $77,161 |
| 2022 | $4,510 | $66,126 | $19,096 | $47,030 |
| 2021 | $4,338 | $66,126 | $19,096 | $47,030 |
| 2020 | $4,465 | $66,126 | $19,096 | $47,030 |
| 2019 | $4,397 | $59,571 | $17,203 | $42,368 |
| 2018 | $4,404 | $59,571 | $17,203 | $42,368 |
| 2017 | $4,183 | $59,571 | $17,203 | $42,368 |
| 2016 | $3,499 | $49,099 | $15,180 | $33,919 |
| 2015 | $3,155 | $49,099 | $15,180 | $33,919 |
| 2014 | $3,177 | $49,099 | $15,180 | $33,919 |
| 2013 | $3,232 | $49,099 | $15,180 | $33,919 |
Source: Public Records
Map
Nearby Homes
- 4808 Chalet Dr
- 4904 Chalet Dr
- 4900 Chalet Dr
- 4905 Chalet Dr
- 1102 Sunnyslope Dr
- 4906 Chalet Dr
- 4009 Beechwood Ave
- 4150 Paddock Rd
- 3990 Beechwood Ave
- 3931 Leyman Dr
- 4232 Langley Ave
- 318 E Mitchell Ave
- 1241 Paddock Hills Ave
- 4 Burton Woods Ln
- 690 Clinton Springs Ave
- 756 Clinton Springs Ave
- 718 Clinton Springs Ave
- 3936 Dickson Ave
- 4910 Greenlee Ave
- 3966 Rose Hill Ave
- 742 Avon Fields Ln
- 736 Avon Fields Ln
- 746 Avon Fields Ln
- 4613 Heger Dr
- 734 Avon Fields Ln
- 4615 Heger Dr
- 741 Avon Fields Ln
- 739 Avon Fields Ln
- 4611 Heger Dr
- 732 Avon Fields Ln
- 735 Avon Fields Ln
- 750 Avon Fields Ln
- 749 Avon Fields Ln
- 4617 Heger Dr
- 4609 Heger Dr
- 731 Avon Fields Ln
- 730 Avon Fields Ln
- 752 Red Bud Ave
- 754 Red Bud Ave
- 6 Avon Fields Place
Your Personal Tour Guide
Ask me questions while you tour the home.